EBITDA Margin
EBITDA margin is the ratio of a company’s EBITDA (earnings before interest, taxes, depreciation and amortization) to its net revenue. It converts the absolute value of EBITDA to a ratio that makes comparison across time and between different companies easier.
EBITDA is a refined measure of income because it excludes the effect of tax laws, capital structure and accounting estimates from net income. Taxes are removed because they are determined not by a company’s management but by the government and hence do not directly reflect a company’s performance. Similarly, the relative proportion of debt and equity in a company’s capital structure is a purely financing decision and need essentially a representation of the operating performance. Lastly, depreciation and amortization are some of the most crucial expense items which are very prone to differences in accounting policies and accounting estimates.
EBITDA margin standardizes the EBITDA with reference to net revenue and facilitates trend analysis (between different periods for a single company) and cross-section analysis (between different companies in same industry).
Formula
EBITDA margin is calculated as follows:
$$ \text{EBITDA margin}=\frac{\text{EBITDA}}{\text{Net Revenue}} $$
Example
Let’s see how EBITDA margin is useful. All the below amounts in USD in millions.
The following table shows extracts from income statement and cash flow statement of PepsiCo.
| Period | 12/30/2017 | 12/31/2016 | 12/26/2015 | 12/27/2014 |
|---|---|---|---|---|
| Total Revenue | $63,525 | $62,799 | $63,056 | $66,683 |
| Interest Expense | $1,151 | $1,342 | $970 | $909 |
| Income Tax | $4,694 | $2,174 | $1,941 | $2,199 |
| Net Income | $4,857 | $6,329 | $5,452 | $6,513 |
| Depreciation and amortization expense | $2,369 | $2,368 | $2,416 | $2,625 |
The following table relates to the Coca Cola Company.
| Period | 12/31/2017 | 12/31/2016 | 12/31/2015 | 12/31/2014 |
|---|---|---|---|---|
| Total Revenue | $35,410 | $41,863 | $44,294 | $45,998 |
| Interest Expense | $841 | $733 | $856 | $483 |
| Income Tax | $5,560 | $1,586 | $2,239 | $2,201 |
| Net Income | $1,248 | $6,527 | $7,351 | $7,098 |
| Depreciation and amortization expense | $1,260 | $1,787 | $1,970 | $1,976 |
The following table shows calculation of their respective net profit margins and EBITDA margins:
| Ratio | 12/31/2017 | 12/31/2016 | 12/31/2015 | 12/31/2014 |
|---|---|---|---|---|
| PepsiCo net margin | 7.65% | 10.08% | 8.65% | 9.77% |
| The Coca Cola Company net margin | 3.56% | 4.27% | 4.45% | 4.30% |
| PepsiCO EBITDA margin | 20.58% | 19.45% | 17.09% | 18.36% |
| The Coca Cola Company EBITDA margin | 25.16% | 25.40% | 28.03% | 25.56% |
EBITDA margin for PepsiCo. for financial year ended 30 Dec 2017 is worked out follows:
$$ \text{EBITDA}({\rm \text{PEP}} _ {\text{2017}})=\frac{\text{\$4,857}+\text{\$4,694}+\text{\$1,151}+\text{\$2,369}}{\text{\$63,525}}=\text{3.56%} $$
Using the same equation, all other EBITDA margins are calculated.
The net profit margin shows that PepsiCo. is more profitable. It also highlights that the profitability of both PepsiCo and the Coca Cola Company has declined in general over the four-year period. However, when we look at the EBITDA margin, it shows that the Coca Cola Company has higher operational profitability when compared to PepsiCo. EBITDA also refutes our earlier conclusion that the profitability of both the companies has declined over the period. The following charts shows a graphical presentation of net profit margin vs EBITDA margin:
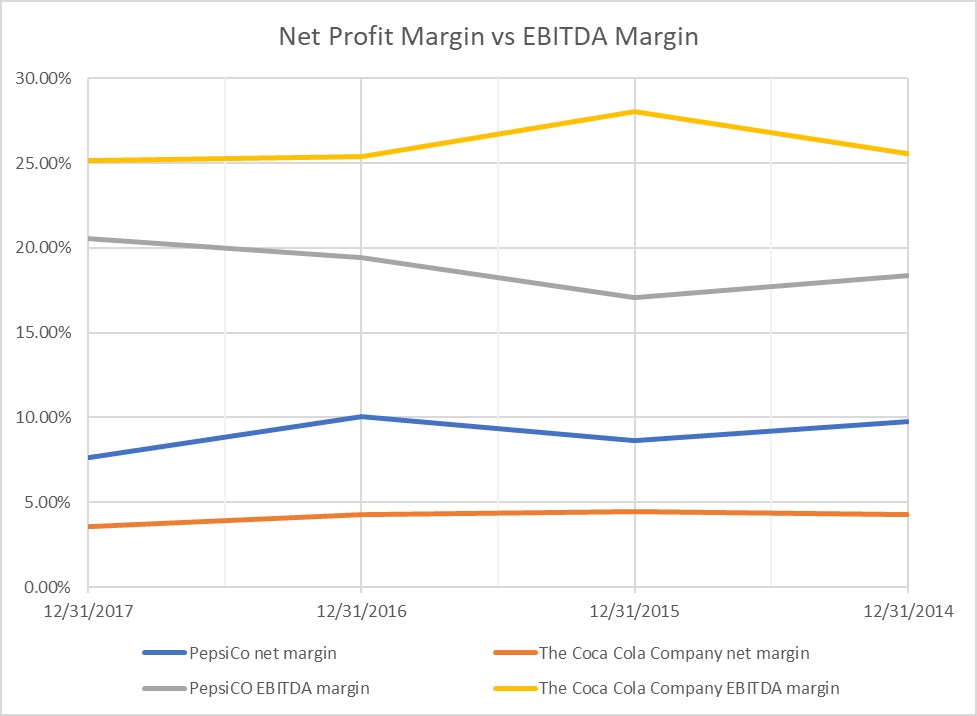
If you look closely you can see that the tax amounts for both companies have sustained a major hike in 2017. Depreciation and amortization and interest expense also vary considerably between two companies and over time. Excluding taxes, interest expense and depreciation and amortization from profitability measurement creates a cleaner picture.
by Obaidullah Jan, ACA, CFA and last modified on