Solvency Ratios
Solvency ratios are financial ratios which measures a company’s ability to pay off its long-term debt and associated interest obligations. Important solvency ratios include debt ratio (i.e. deb to assets ratio), debt to equity ratio, financial leverage ratio (also called equity multiplier) and interest coverage ratio.
While liquidity represents a company’s ability to meet its current liabilities using current assets, solvency refers to a company’s long-term financial strength. It involves comparing total assets with total liabilities to study the company’s overall capital structure and assess its ability to make both principal and interest payments.
The following table lists important solvency ratios and their formulas:
| Ratio | Formula |
|---|---|
| Debt ratio (also called debt to assets ratio) | Total Debt/Total Assets |
| Debt to equity ratio | Total Debt/Total Equity |
| Debt to capital ratio | Total Debt/(Total Debt + Total Equity |
| Financial leverage ratio | Average Total Assets/Average Total Equity |
| Times interest earned ratio | EBIT/Interest |
Debt ratio
Debt ratio is the most popular solvency ratio. It is calculated by dividing total debt by total assets. Total debt equals interest-paying short-term and long-term debt. Total debt doesn’t exactly equal total liabilities.
A higher debt ratio means that the company has more debt in its capital structure which it may find difficult to pay back.
Debt to equity ratio
Debt to equity ratio is another ratio that measures the relative portion of debt and equity in a company’s capital structure. A higher debt to equity ratio means a higher debt ratio and higher financial risk.
Debt to equity ratio can be converted to debt ratio and vice versa using the following equation:
| Debt Ratio = | D/E Ratio |
| 1 + D/E Ratio |
Debt to capital ratio
Debt to capital ratio measures the proportion of debt with reference to a company’s total capital which equals total debt and shareholders equity.
Debt to capital ratio is similar to debt ratio except for the subtle difference in their denominator. Debt ratio has total assets in its denominator while debt to capital ratio has total capital in its denominator which is not exactly equal to total assets. Total capital is less than total assets which makes debt to capital ratio higher than the debt ratio.
Financial leverage ratio
Financial leverage ratio (also called leverage ratio or equity multiplier) is just another expression of relationship between debt, equity and total assets/capital. Financial leverage ratio measures dollars of total assets per dollar of shareholders equity. It is an important input in in the DuPont analysis of return on equity.
Times interest earned ratio
Times interest earned ratio is a ratio that measures the interest-bearing capacity of a company. It is calculated by dividing the earnings before interest and taxes (EBIT) by the interest expense. A higher ratio means that the company profitability is enough to cover the interest expense. It is also called interest coverage ratio.
Example
The following tables calculates debt ratio, debt to equity ratio, debt to capital ratio and financial leverage ratio for Applied Materials Inc (NYSE: AMAT) for the last 5-years:
| USD in million | Calculation | 2013 | 2014 | 2015 | 2016 | 2017 |
|---|---|---|---|---|---|---|
| Total assets | A | 12,043 | 13,174 | 15,308 | 14,588 | 19,419 |
| Short-term debt | SD | 1,200 | 200 | |||
| Accounts payable | 582 | 613 | 658 | 813 | 945 | |
| Taxes payable | 114 | 193 | 118 | 151 | 182 | |
| Accrued liabilities | 415 | 431 | 432 | 467 | 551 | |
| Deferred revenues | 794 | 940 | 765 | 1,376 | 1,665 | |
| Other current liabilities | 538 | 646 | 625 | 625 | 772 | |
| Total current liabilities | CL | 2,443 | 2,823 | 3,798 | 3,632 | 4,115 |
| Long-term debt | LD | 1,946 | 1,947 | 3,342 | 3,143 | 5,304 |
| Deferred taxes liabilities | 71 | 32 | 56 | 1 | ||
| Pensions and other benefits | P | 193 | 208 | 187 | 182 | 160 |
| Other long-term liabilities | 302 | 296 | 312 | 413 | 491 | |
| Total non-current liabilities | NL | 2,512 | 2,483 | 3,897 | 3,739 | 5,955 |
| Total liabilities | L | 4,955 | 5,306 | 7,695 | 7,371 | 10,070 |
| Total stockholders' equity | E | 7,088 | 7,868 | 7,613 | 7,217 | 9,349 |
| Debt ratio | (SD+LD+P)/A | 0.18 | 0.16 | 0.31 | 0.24 | 0.28 |
| Debt to equity ratio | (SD+LD+P)/E | 0.30 | 0.27 | 0.62 | 0.49 | 0.58 |
| Debt to capital ratio | (SD+LD+P)/ (SD+LD+P+E) |
0.23 | 0.22 | 0.38 | 0.33 | 0.37 |
| Financial leverage ratio | A/E | 1.69 | 1.84 | 2.02 | 2.05 |
You can verify that the company’s interest coverage ratio in the last five years has stayed in the range of 4.68-19.84, the highest being in 2016.
The following chart graphs the ratios:
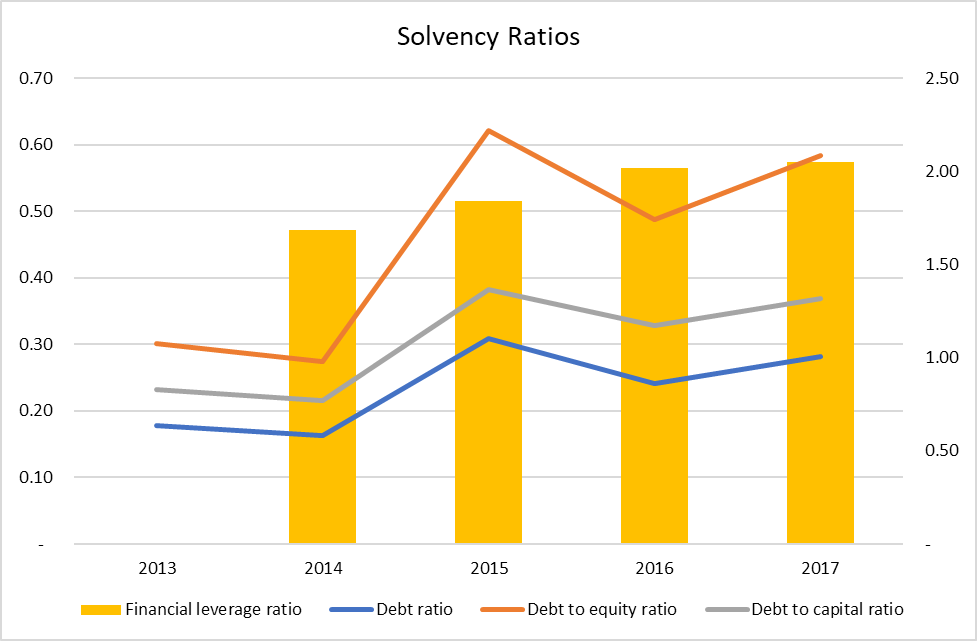
You can see that debt ratio, debt to equity ratio and debt to capital ratio all move together. Further, Debt to capital ratio is more conservative than the debt ratio.
In case of Applied Materials, Inc., the debt ratio and debt to capital ratio has consistently stayed below 0.4 which means that the company has less than $40 of debt per $100 of total capital. This coupled with a very high times interest earned ratio means that the company has very strong solvency position.
by Obaidullah Jan, ACA, CFA and last modified on