EV to EBITDA
EV/EBITDA (also known as the enterprise multiple) is the ratio of a company’s enterprise value to its earnings before interest, taxes, depreciation and amortization (EBITDA). It is a valuation ratio which is arguably better than the P/E ratio because it insulates the difference between companies’ financial performance that arises out of their accounting estimates, capital structure and taxation.
Enterprise value is the total value of a company estimated as the sum of its equity value (i.e. market capitalization) and market value of minority interest, preferred stock and debt minus its cash and cash equivalents balance. EBITDA equals net income plus taxes, interest expenses, depreciation and amortization. Enterprise value is a more comprehensive measure of a target’s value as compared to market capitalization because it accounts for the market value of the company’s debt capital. EBITDA is a more stable and cleaner measure of operating performance as compared to net income because it ignores the effect of accounting policies, financing decisions and tax status of companies.
There are two variants of EV/EBITDA: (a) trailing EV/EBITDA which uses trailing twelve months (TTM) EBITDA values and (b) forward EV/EBITDA which uses projected twelve-months EBITDA.
Formula
EV/EBITDA multiple can be worked out using the following formula:
| EV/EBITDA = | Enterprise Value |
| EBITDA |
| EV/EBITDA = | VE + VP + VD - C |
| NI + T + I + D + A |
Where VE is the market value of equity (i.e. number of shares of common stock outstanding multiplied by the current share price), VP is the market value of preferred stock, VD is the market value of debt and C stands for cash and cash equivalents. NI is net income, T is the tax expense, I is interest expense, D is depreciation expense and A is amortization expense.
Example: EV/EBITDA calculation
Follow here if you want to learn: EBITDA and Enterprise Value.
Let’s work out EV/EBITDA given the following data:
| USD in millions | 2013 | 2014 | 2015 | 2016 | 2017 |
|---|---|---|---|---|---|
| EBITDA | 15,833 | 11,887 | 16,178 | 22,664 | 24,699 |
| Cash and cash equivalents | 20,021 | 18,954 | 15,238 | 12,960 | 15,512 |
| Short-term investments | 8,972 | 9,222 | 8,163 | 11,841 | 8,313 |
| Short-term debt | 14,158 | 14,988 | 18,745 | 29,028 | 26,965 |
| Long-term debt | 22,025 | 31,853 | 35,601 | 55,600 | 67,254 |
| No. of shares of common stock outstanding (millions) | 1,200 | 1,220 | 1,220 | 1,250 | 1,400 |
| Stock price | 27 | 38 | 37 | 40 | 35 |
We already have EBITDA values ready, but we need to work out enterprise value for each year which equals the sum of equity value and market value of debt minus cash and cash equivalents.
EV2017
= VE + VP + VD - C
=1,400M × $35 + $67,256M + $29,965M − ($15,512M + $8,313M)
= $119,394M
| EV/EBITDA (2017) = | $119,394M | = 4.83 |
| $24,699 |
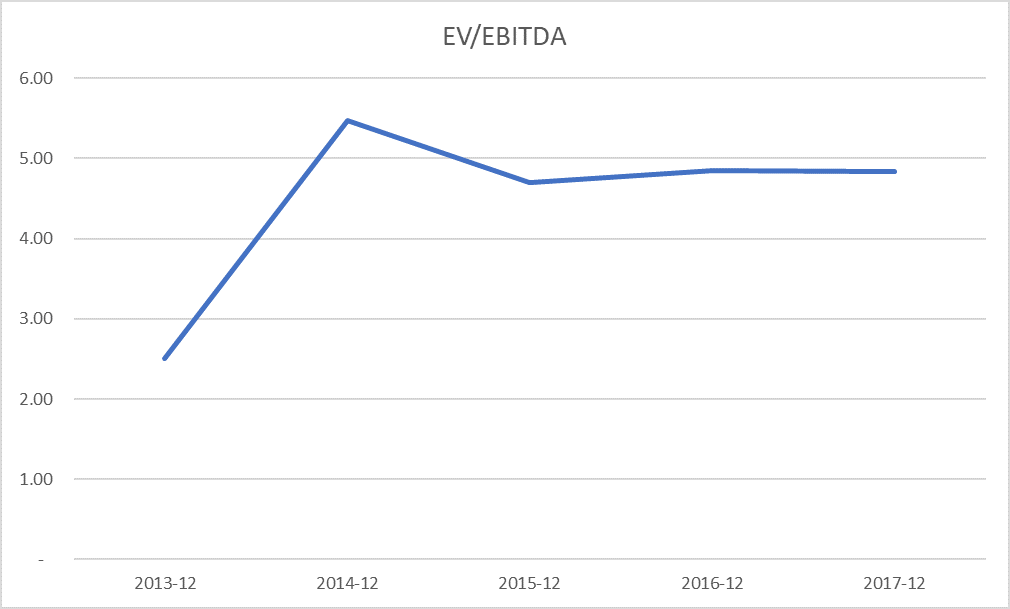
Using the same formula, we can calculate EV/EBITDA for other years. The following table and chart shows EV/EBITDA for the 5-years:
| Calculation of EV/EBITDA | 2013-12 | 2014-12 | 2015-12 | 2016-12 | 2017-12 |
|---|---|---|---|---|---|
| Enterprise value | 39,590 | 65,025 | 76,085 | 109,827 | 119,394 |
| EBITDA | 15,833 | 11,887 | 16,178 | 22,664 | 24,699 |
| EV/EBITDA | 2.50 | 5.47 | 4.70 | 4.85 | 4.83 |
The chart below shows that the company was undervalued in 2013 and its valuation has stabilized over the future values at around 5.
EV/EBITDA makes comparison with other companies more meaningful because it is not affected by capital structure, tax status and accounting estimates related to depreciation and amortization.
by Obaidullah Jan, ACA, CFA and last modified on