Debt Coverage Ratio
Debt coverage ratio is a cash-flow based solvency ratio which measures the adequacy of cash flow from operations in relation to a company’s total debt level. It is calculated by dividing the cash flows from operations by the total debt. A high debt coverage ratio is better.
You can think of the debt coverage ratio as a measure of the inverse of the number of periods (say years) that it will take a company to pay off its total debt if it has zero net cash flows from investing activities and no other cash flows from financing activities except the repayment of loan. The higher the debt coverage ratio, the lower will this period be and vice versa.
Interest coverage ratio is a similar measure that determines the sufficiency of cash flows from operations with reference to a company’s interest payment obligations.
Debt coverage ratio is different from debt service coverage ratio which is a ratio of a property’s net operating income to the property related debt payment (both principal and interest).
Formula
Debt coverage ratio can be calculated using the following formula:
$$ \text{Debt Coverage Ratio}=\frac{\text{CFO}}{\text{Total Debt}} $$
CFO stands for net cash flows from operations. This figure can be obtained from a company’s cash flow statement. If no cash flow statement is available, it can be determined by adding non-cash expenses such as depreciation and amortization to net income and adjusting it for changes in working capital.
Relationship between cash flows from operations and total debt is meaningful because a company will ultimately pay off its debt using the cash generated from operations.
Example
Following is a calculation of debt coverage ration for General Electric financial statements for the last five years:
| USD in million | 2013 | 2014 | 2015 | 2016 | 2017 |
|---|---|---|---|---|---|
| Net cash provided by operating activities | 28,579 | 27,710 | 19,891 | (244) | 10,426 |
| Total liabilities | 519,777 | 511,516 | 389,582 | 284,668 | 292,560 |
| Debt coverage ratio | 5.5% | 5.4% | 5.1% | -0.1% | 3.6% |
Here is the calculation for Siemens AG, GE’s main competitor over the same period:
| EUR in millions | 2013 | 2014 | 2015 | 2016 | 2017 |
|---|---|---|---|---|---|
| Net cash provided by operating activities | 7,340 | 7,100 | 6,612 | 7,611 | 7,176 |
| Total liabilities | 73,311 | 73,365 | 85,292 | 90,901 | 89,277 |
| Debt coverage ratio - Siemens | 10.0% | 9.7% | 7.8% | 8.4% | 8.0% |
The following charts shows the result visually:
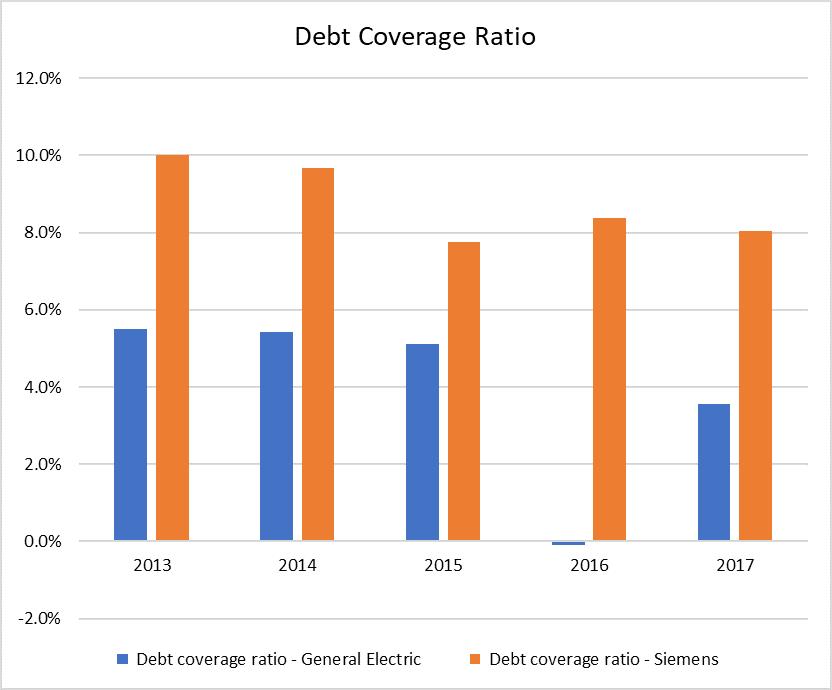
It clearly shows that Siemens has significantly better solvency position than GE if measured solely by the debt coverage ratio.
GE’s solvency as measured by the debt coverage ratio remained stable in 2013-2015 even though at a debt coverage ratio of less than 6%, it would take the company 17 years to pay off all its debt if it had to. In 2016, GE’s cash flows from operations turned negative which represented significant solvency problem.
by Obaidullah Jan, ACA, CFA and last modified on