Cash to Income Ratio
Cash to income ratio is a cash flow ratio which measures dollars of cash flows from operating activities per dollar of operating income. It is calculated by dividing cash flows from operations by the operating income. Operating income roughly equals earnings before interest and taxes.
Because accrual-based income measures such as net income, earnings before tax and operating income, etc. are subject to a range of accounting policies and estimates which are based on management discretion, analysts evaluate cash flow-based measures of financial performance and financial strength to validate the results obtained from accrual-based performance measures. Cash to income ratio is a litmus test which tells use the proportion of operating income which is based by operating cash flows. A low cash to income ratio might be because of management’s attempt to accelerate recognition of revenue. A very high ratio might also indicate revenue management.
Formula
Cash to income ratio can be calculated using the following formula:
$$ \text{Cash to Income Ratio}=\frac{\text{CFO}}{\text{Operating Income}} $$
Where CFO stands for cash flows from operations and it represents the net cash generated from operating activities. It is reported on a company’s statement of cash flows. Alternatively, it can be calculated by adjusting net income for depreciation and other non-cash charges and changes in current assets and current liabilities.
Operating income equals earnings before interest and taxes (EBIT). Non-operating income such as interest income is also excluded. A major difference exists between CFO and EBIT on account of depreciation and amortization expense as we will illustrate below.
The numerator and denominator of the cash to income ratio are both highly relevant. The numerator is the cash-flow equivalent of the denominator i.e. both exclude taxes and interest expense and non-operating income
Example
The following data is extracted from financial statements of Sprint Corp for the last 3 years:
| USD in million | 2015 | 2016 | 2017 |
|---|---|---|---|
| Net cash provided by operating activities | 2,450 | 3,897 | 4,168 |
| Interest Expense | 2,051 | 2,182 | 2,495 |
| Other income (expense) | (2,410) | (391) | (106) |
| Provision for income taxes | (574) | 141 | 435 |
| Net income from continuing operations | (3,345) | (1,995) | (1,206) |
| EBITDA | 3,481 | 7,416 | 9,874 |
Net cash flows from operations for the three years is obtained from the cash flow statement and the net income, provision for income tax, interest expense and other income (expense) is obtained from income statement.
Operating income in 2015 is $542 million (i.e. -3,345 million + (-574 million) - (-2,410 million) + $2,051 million). Similarly, operating income for 2016 and 2017 work out to $719 million and $1,830 million.
The cash to income ratio for 2015, 2016 and 2017 works out to 4.52, 5.42 and 2.28.
The cash flows from operations is multiple times the operating income mainly due to depreciation and amortization expense which is a non-cash item. This difference will always exist. We need to consider only the movement in the ratio to see if it they are in line. The following visual presentation helps.
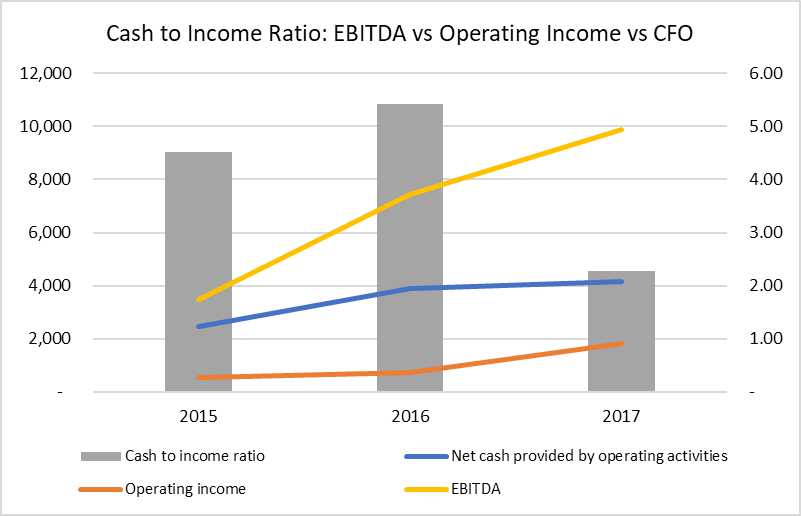
The company’s cash flows from operations and operating income has moved together to a large extent which indicates good cash flow performance because there are no surprises.
by Obaidullah Jan, ACA, CFA and last modified on