Liquidity Ratios
Liquidity ratios are financial ratios which measure a company’s ability to pay off its short-term financial obligations i.e. current liabilities using its current assets. Most common liquidity ratios are current ratio, quick ratio, cash ratio and cash conversion cycle. A high current ratio, quick ratio and cash ratio and a low cash conversion cycle shows good liquidity position.
In analyzing a company’s financial position, we are concerned with two timelines, the short-run and the long-run. The short-run represents a time period of 12 months and the long-run means a time period of more than 1 year. Liquidity is relevant to the short-run while solvency is applicable in the long-run. Almost all liquidity ratios measure relationships between current assets and current liabilities. Current assets are assets which are expected to generate cash flows within one operating cycle or with 12 months and current liabilities are obligations which must be paid within one operating cycle or within 12 months.
The following table shows the most common liquidity ratios, their calculation and analysis:
| Liquidity ratio | Formula |
|---|---|
| Current ratio | Current Assets/Current Liabilities |
| Quick ratio | (Cash + Short-term Marketable Securities + Receivables)/Current Liabilities |
| Cash ratio | (Cash + Marketable Securities)/Current Liabilities |
| Cash conversion cycle | DIO + DSO - DPO |
Current ratio
Current ratio is the most popular liquidity ratio. It is calculated by dividing the current assets by the current liabilities. It is also called working capital ratio. A ratio greater than 1 shows that the company expects to receive more cash inflows from liquidation of current assets than it expects to pay on account of current liabilities in next 12 months. The balance sheets typically show current assets and current liabilities separately from non-current assets and non-current liabilities. Typical current assets include prepayments, inventories, accounts receivable, short-term marketable securities and cash and typical current liabilities include accounts payable, short-term notes payable, short-term loans payable, taxes payable, unearned revenue and accrued expenses.
Quick ratio
Quick ratio (also called acid-test ratio) is a liquidity ratio that compares those current assets that can be quickly liquidated with current liabilities. Quick assets include cash, short-term marketable securities and accounts receivable. Other current assets such as prepayments and inventories are excluded in calculating quick ratio because prepayments and inventories must first become receivable and only then can they be expected to be liquidated. Quick ratio is also called acid test ratio. An alternative less common formula to calculate quick ratio is to exclude prepayments and inventories from current assets and divide it by current liabilities.
Cash ratio
Cash ratio is an even more stringent liquidity measure. It effectively compares cash and cash equivalents balance with current liabilities. It is calculated by dividing cash and short-term marketable securities by the current liabilities.
Cash conversion cycle
Cash conversion cycle (also called net operating cycle) calculates the net number of days a company’s cash is tied up. It equals the days its takes a company in selling its inventories i.e. days inventories outstanding (DIO)) plus the days it takes it to collect cash from receivables i.e. days sales outstanding (DSO) minus days it takes in paying its creditors i.e. days payables outstanding (DPO). A shorter cash conversion cycle is better. Liquidity analysis should include a trend analysis and a cross-sectional analysis. The trend analysis involves comparing liquidity ratio in past periods with current period while the cross-sectional analysis involves comparing one company at one point of time with its competitors.
Please note all the three main liquidity ratios are balance sheet ratios.
Example
Following is an extract from balance sheet of ExxonMobil (NYSE: XOM) and calculation of relevant ratios:
| USD in million | Calculation | 2013 | 2014 | 2015 | 2016 | 2017 |
|---|---|---|---|---|---|---|
| Current assets | ||||||
| Cash and cash equivalents | C | 4,644 | 4,616 | 3,705 | 3,657 | 3,177 |
| Receivables | AR | 33,152 | 28,009 | 19,875 | 21,394 | 25,597 |
| Inventories | I | 16,135 | 16,678 | 16,245 | 15,080 | 16,992 |
| Other current assets | 5,377 | 3,607 | 2,798 | 1,285 | 1,368 | |
| Total current assets | CA | 59,308 | 52,910 | 42,623 | 41,416 | 47,134 |
| Current liabilities | ||||||
| Accounts payable | 30,920 | 25,286 | 18,074 | 17,801 | 21,701 | |
| Short-term debt | 15,808 | 17,468 | 18,762 | 13,830 | 17,930 | |
| Income taxes payable | 7,831 | 4,938 | 2,802 | 2,615 | 3,045 | |
| Other current liabilities | 17,165 | 16,941 | 14,338 | 13,392 | 15,095 | |
| Total current liabilities | CL | 71,724 | 64,633 | 53,976 | 47,638 | 57,771 |
| Current ratio | CA/CL | 0.83 | 0.82 | 0.79 | 0.87 | 0.82 |
| Quick ratio | (C+AR)/CL | 0.53 | 0.50 | 0.44 | 0.53 | 0.50 |
| Cash ratio | C/CL | 0.06 | 0.07 | 0.07 | 0.08 | 0.05 |
The following chart shows the results graphically:
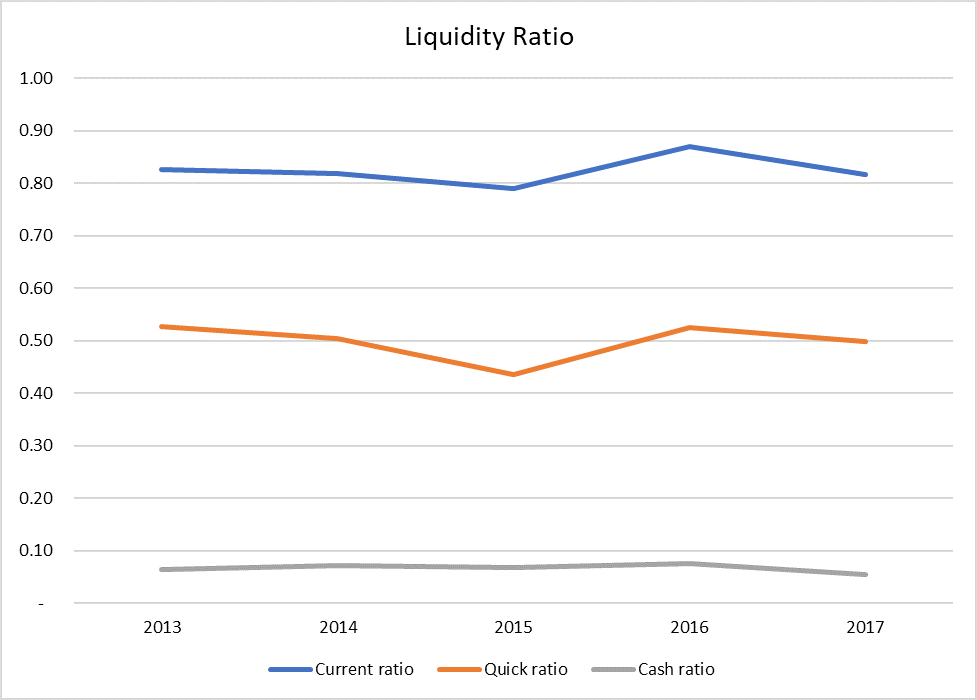
The current ratio has hovered between 0.8 and 0.9 in the last five years which seems safe because its close to 1. However, its lower than its main competitor Chevron whose current ratio has been greater than 1 in 4 out the last 5 years. The quick ratio is quite low at 0.5 which shows that a big chunk of the company’s current assets comprises of inventories which are slow-moving. Chevron’s quick ratio has stayed in the range of 0.66-1.16 in the last 5 years which is significantly better than Exxon Mobil’s.
by Obaidullah Jan, ACA, CFA and last modified on