Operating Cash Flow Ratio
Operating cash flow ratio measures the adequacy of a company’s cash generated from operating activities to pay its current liabilities. It is calculated by dividing the cash flow from operations by the company’s current liabilities. Operating cash flow ratio determines the number of times the current liabilities can be paid off out of net operating cash flow. A higher ratio is better.
Operating cash flow ratio is an important measure of a company’s liquidity i.e. its ability to pay off short-term financial obligations. It should be considered together with other liquidity ratios such as current ratio, quick ratio, cash ratio, etc.
Formula
Operating cash flow ratio is calculated by dividing the cash flow from operations (also called cash flow from operating activities) by the closing current liabilities.
| Operating Cash Flow Ratio = | Cash Flow from Operations |
| Current Liabilities |
Cash flow from operations is reported on a company’s statement of cash flows and the current liabilities is presented on a company’s balance sheet.
If cash flow statement is not available, cash flow from operations can be determined by starting with net income, adding non-cash expenses such as depreciation expense, etc., subtracting non-cash gains such as gain on sale of fixed assets, etc., adding any increase in current liabilities or decrease in current assets and subtracting any decrease in current liabilities and increase in current assets.
Example
The following table shows calculation of operating cash flow of Intel Corporation:
| USD in millions | 2013 | 2014 | 2015 | 2016 | 2017 |
|---|---|---|---|---|---|
| Net cash provided by operating activities (A) | 20,776 | 20,418 | 19,017 | 21,808 | 22,110 |
| Total current liabilities (B) | 13,568 | 16,019 | 15,667 | 20,302 | 17,421 |
| Operating cash flow ratio (A/B) | 1.53 | 1.27 | 1.21 | 1.07 | 1.27 |
The following graph shows the trend:
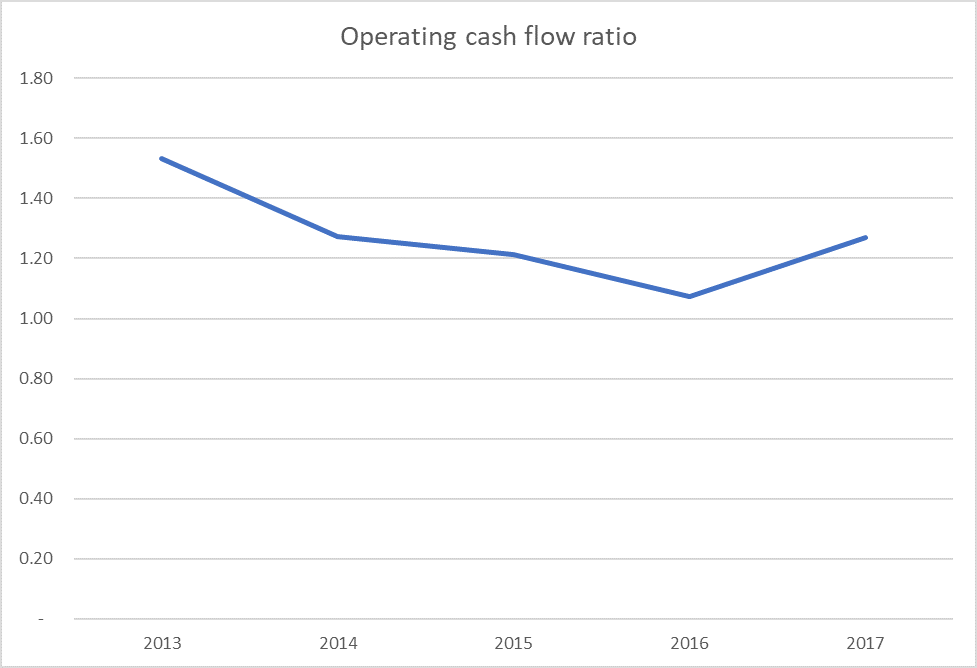
The company have consistently maintained operating cash flow ratio of more than 1. The ratio was the highest in 2013 and lowest in 2016. If we drill deeper, we find that the drop in the ratio in 2014-2016 was due to increase in current liabilities balance instead of any major drop in cash flow from operations.
by Obaidullah Jan, ACA, CFA and last modified on