Expansion Path
Expansion path is a graph which shows how a firm’s cost minimizing input mix changes as it expands production. It traces out the points of tangency of the isocost lines and isoquants.
An expansion path provides a long-run view of a firm’s production decision and can be used to create its long-run cost curves. Since we define long-run as a time period in which a firm can change all its inputs including capital, the expansion path depends on how the firm changes its input mix.
An isocost line plots such combinations of inputs at which the firm’s total cost is constant. An isoquant represents such combination of inputs which generate the same amount of output. A profit-maximizing firm is interested in producing maximum output at minimum cost. This occurs at a point at which its isocost line is tangent to the relevant isoquant. As the firm increases its input budget while the unit costs of inputs remain the same, the firm’s isocost lines shift outwards such that they touch higher and higher isoquants. If we connect all such points at which isocost lines are tangent to the isoquants, we get the firm’s expansion path.
Normal Input vs Inferior Input
A firm’s expansion path tells us whether the firm’s inputs are normal inputs or inferior inputs.
An input is a normal input if the firm increases its proportion in its production mix as it increases production. An inferior input, on the other hand, is an input whose proportion decreases as the firm switches to other inputs at higher production level. The expansion path slopes away from an inferior input i.e. it has negative slope. But in case of a normal input, the expansion path has a positive slope.
Example
Assume you manage a fast-food chain which has hundreds of outlets. You must decide whether to install self-service kiosks or hire more labor as you expand your chain. If each kiosk cost $500 and each labor hour costs $15, the following graph shows your cost-minimizing and production-maximizing combination of capital and labor at different production levels:
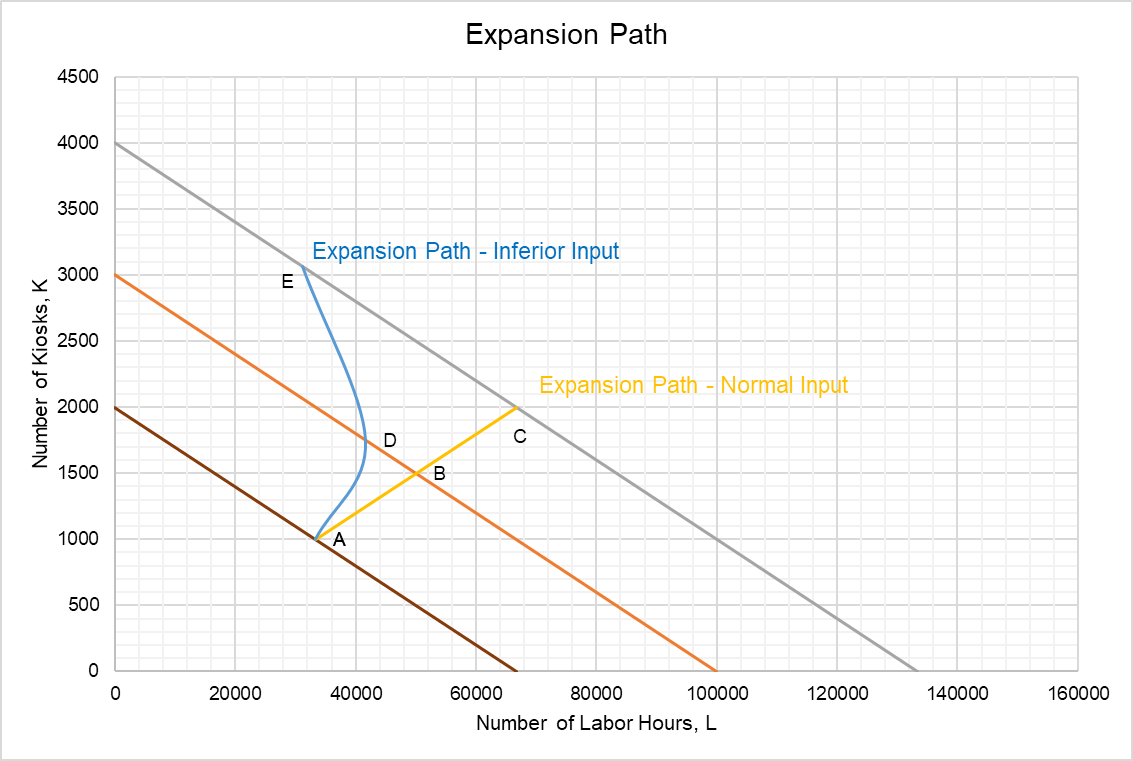
Assume you initially had $1,000,000 to allocate between labor and capital. You could rent 2,000 kiosks at $500 per kiosk per month or 66,667 hours of labor at $15 per hour. This is represented by the innermost isocost line. Point A is the cost-minimizing point i.e. the point of tangency of isocost line to isoquant (which is omitted for sake of simplicity).
Now, imagine you decide to expand output and your budget increases to $1,500,000. This enables you to lease out 3,000 kiosks or 100,000 labor hours as represented by the middle isocost line. If labor and capital are equally productive, your new cost-minimization point is B. Your cost-minimization point moves to Point C if you budget increases to $2,000,000. Since the proportion of labor and capital has remained the same even after increase in production, they are normal inputs and the line connecting Point A, B and C is a positively-slopped expansion path.
But what if capital becomes more productive and you substitute more capital for labor as your budget expands as shown by Point D and E. This gives you an expansion path which slopes negatively as you move from Point D to E. This shows that in this output range, labor is an inferior input.
by Obaidullah Jan, ACA, CFA and last modified on