Isocost Line
An isocost line is a graph of combinations of labor and capital, or any other two factors of production, such that the total cost remains the same.
An isocost line is the producers what a budget line is to a consumer. While a budget line shows a consumer’s maximum income, an isocost line shows the maximum amount which a firm is willing to expend on production.
The interplay of a firm's isocost line and its isoquants determine the firm's production. The point at which the isocost line is tangent to the highest-possible isoquant is the point at which the firm maximizes its output keeping in view its cost constraints.
Example
An isocost cost line can be drawn for any two factors of production if we know the total cost budget and prices per unit of each input. Assume you manage a large fast-food chain which has hundreds of outlets. You must decide whether to lease out self-serve kiosks (capital) or hire workers (labor). Your annual budget is $1 million, monthly lease cost of a kiosk is $500 and wage rate per hour is $15. There are two extreme cases of allocation of the budget between labor and capital: (a) spend the whole budget on kiosks and do not hire new workers or (b) hire new workers but no new unit of capital. In the first case, $1 million enables you to rent 2,000 kiosks ($1,000,000 divided by $500). In the second case, $1 million is sufficient to acquire 66,667 labor hours. If we plot capital on y-axis and labor on x-axis, there two cases give us two points on the graph: (0, 66667) and (2000,0).
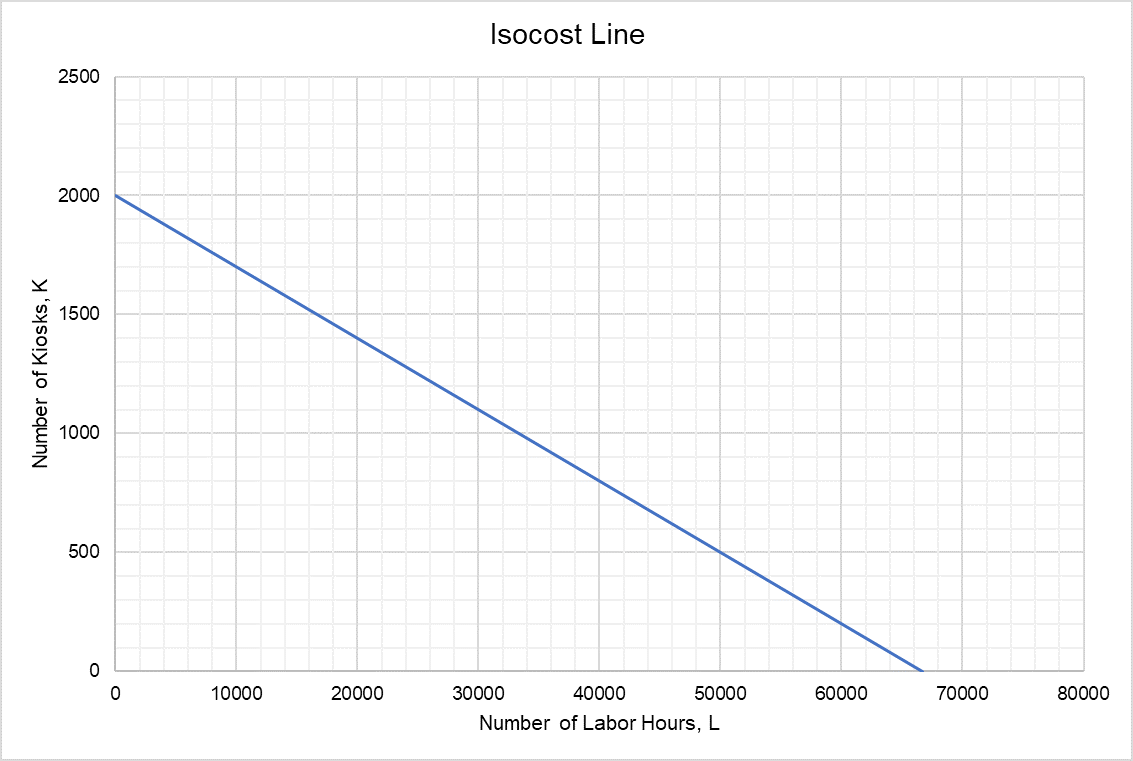
If C is total cost, r is the user cost of capital, w is the wage rate and K and L are the units of capital and labor respectively, we can write a general equation for isocost line as follows:
$$ \text{C}\ =\ \text{r}\times \text{K}+\text{w}\times \text{L} $$
Converting this to the standard straight-line equation format, we get:
$$ \text{K}\ =\ \frac{\text{C}}{\text{r}}-\frac{\text{w}}{\text{r}}\times \text{L} $$
This shows that the slope of the isocost line is -w/r.
Shifts in Isocost Line
A firm’s isocost line can shift if there is (a) a change in total expenditure of the firm on inputs and (b) change in price of the inputs.
If a firm decides to spend more money on production, its isocost line shifts outwards/rightwards parallel to the original isocost line. It is because more budget allows the firm to simultaneously employ more capital and labor at the same time. A reduction in budget would have an exactly opposite effect i.e. it would move the isocost line inwards.
A parallel shift can also happen if prices of both inputs change by equal proportion. However, where the change in prices of inputs is not proportionate, it changes the slope of the isocost line (recall the fact that the slope of the isocost line equals the ratio of price of one factor to the other). Such a change in slope rotates the isocost line.
by Obaidullah Jan, ACA, CFA and last modified on