Consumption Function
Consumption function is an equation that shows how personal consumption expenditure changes in response to changes in disposable income, wealth, interest rate, etc. Generally, consumption equals autonomous consumption plus the product of marginal propensity to consume and disposable income.
Consumption is the largest component of a country’s gross domestic product (GDP). It includes non-commercial expenditure which people incur on final goods and services such as food, clothing, education, entertainment, furniture, cars, computers, etc.
The most popular consumption function is the Keynesian consumption function which shows that consumption (C) depends on autonomous spending (c0), marginal propensity to consume (MPC) and disposable income (YD).
$$ \text{C}=\text{c} _ \text{0}+\text{MPC}\times\ \text{Y} _ \text{D} $$
c0 is a constant which represents the autonomous consumption, that is the consumption that exists even at zero-income level. Even if people have no current income, they spend on food and clothing out of savings or by borrowing money.
Marginal propensity to consume (MPC) is the percentage of each additional dollar which people consume. For example, if a consumer spends $60 of any $100 increase income, his marginal propensity to consume is 0.6.
Disposable income (YD) equals the net income available to consumers for spending after payment of taxes. It equals Y × (1 – t) where t is the tax rate.
Substituting the definition of disposable income into the equation above, we get an expanded version of the consumption function:
$$ \text{C}=\text{c} _ \text{0}+\text{MPC}\times\ \text{Y}\times(\text{1}-\text{t}) $$
Graph and Example
Let’s consider Mark who must spend $500 each month on food and clothing. If his marginal propensity to consume is 0.7 and tax rate is 0.3, we can write his consumption function as follows:
$$ \text{C}=\text{\$500}+\text{0.7}\times\ \text{Y}\times(\text{1}-\text{0.3}) $$
If we plot the consumption function above, we get a straight-line which is generally considered a good approximation of reality.
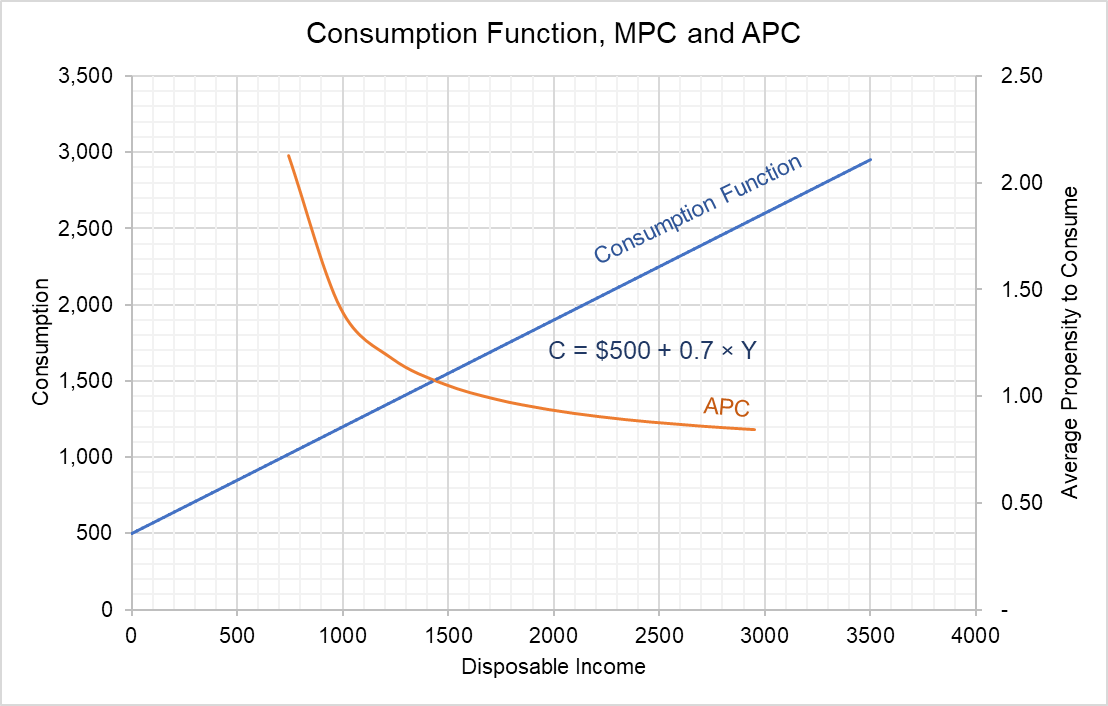
The slope of the consumption equals the marginal propensity to consume.
Average Propensity to Consume (APC)
Average propensity to consume, the ratio of total consumption to total disposable income, can be worked out by dividing consumption with total income as follows:
$$ \text{APC}=\frac{\text{C}}{\text{Y} _ \text{D}}=\frac{\text{c} _ \text{0}}{\text{Y} _ \text{D}}+\text{MPC}\times\ \frac{\text{Y} _ \text{D}}{\text{Y} _ \text{D}}=\frac{\text{c} _ \text{0}}{\text{Y} _ \text{D}}+\text{MPC} $$
In case of Mark, the average propensity to consume (APC) curve decreases with increase in total income. It is 2.13 when disposable income is $350 and drops to 0.84 when disposable income is $3,500.
Even the basic Keynesian consumption function is useful for a broad level analysis, some other economists have proposed refinements to the consumption function. These refinements on based on the intuition that consumers factor in their future earnings and interest rate in deciding their consumption level today. Two important alternate consumption functions are based on (a) life cycle hypothesis and (b) permanent income hypothesis. The life-cycle hypothesis argues that consumption is a function of both wealth and income. The permanent income hypothesis, on the other hand, postulates that people base their consumption decision only income which they reasonably expect to continue in future and not on any transitory one-off income.
by Obaidullah Jan, ACA, CFA and last modified on