Monopoly Price and Output
A monopoly can maximize its profit by producing at an output level at which its marginal revenue is equal to its marginal cost.
A monopolist faces a downward-sloping demand curve which means that he must reduce its price in order to sell more units. Marginal cost curve of the monopolist is typically U-shaped, i.e. it decreases initially but ultimately starts rising due to diminishing returns to scale. The profit-maximizing quantity and price correspond to the point at which the marginal revenue and marginal cost curves of the monopolist intersects.
Let’s consider Braavos, Inc., a monopolist whose demand is given by the following equation:
$$ \text{P}\ =\ \text{150}\ -\ \text{3Q} $$
If Braavos wants to produce 20 units, it must set its price equal to $90 (=150 – 3 ×20) but for the 21st unit, the price must drop to $87 (=150 – 3 ×21). Since the price drops for all units (not just the 21st), the increase in production by 1 would result in a decrease in revenue from 21 units of $63 as shown below
$$ \text{Drop in Revenue}=\text{21}\times\frac{\text{87}\ -\ \text{90}}{\text{21}\ -\ \text{20}}=-\text{63} $$
But the 21st unit fetches $87, so the net change in revenue (i.e. the marginal revenue) from 21st unit is $24 (=87 – 63).
Marginal Revenue, Price and Total Revenue
Following the example above, we can generalize the relationship between marginal revenue and price of a monopolist as follows:
$$ \text{MR}=\text{P}+\text{Q}\times\frac{\Delta \text{Q}}{\Delta \text{P}} $$
Where MR is marginal revenue, P is price, Q is quantity, ∆Q is change in quantity and ∆P is change in price.
Since P is the price (the average revenue), the total revenue function for a monopolist for any output Q can be written as follows:
$$ \text{R}=\text{Q}\times(\text{150}\ -\ \text{3Q})=\text{150Q}\ -\ \text{3Q}^\text{2} $$
Differentiating the revenue function gives us the monopolist’s marginal revenue:
$$ \text{MR}\ =\ \text{150}\ -\ \text{6Q} $$
If we plug Q = 21, we get MR = $24. We get the same result using either relationship i.e. between price and MR or between MR and quantity.
We can generalize that if a firm’s inverse demand function is of the form P = a – bQ, its marginal revenue (MR) equation can be written as follows:
$$ \text{MR}=\text{a}\ -\ \text{2bQ} $$
Choke price
In the above equation, a is the choke price, a price at which a monopolist won’t be able to sell anything, and b is the slope of the demand curve.
It follows that a monopolist’s marginal revenue curve lies midway below its demand curve as shown in the graph below.
Total Cost and Marginal Cost
A monopolist’s total cost and marginal cost curves are just like in perfect competition. Let’s assume that Braavos, the monopolist discussed above, has the following total cost and marginal cost functions:
$$ \text{TC}\ =\ \text{0.1Q}^\text{3}-\ \text{2Q}^\text{2}+\text{60Q}+\text{200}\ $$
$$ \text{MC}\ =\ \text{0.3Q}^\text{2}-\ \text{4Q}+\text{60}\ $$
Profit-Maximizing Output and Price
Monopoly profit is maximized at a point at which the monopoly’s marginal revenue is equal to its marginal cost. There are two ways to find the optimal output and price: graphical and mathematical.
The following graph shows the profit-maximizing output and price of a monopolist.
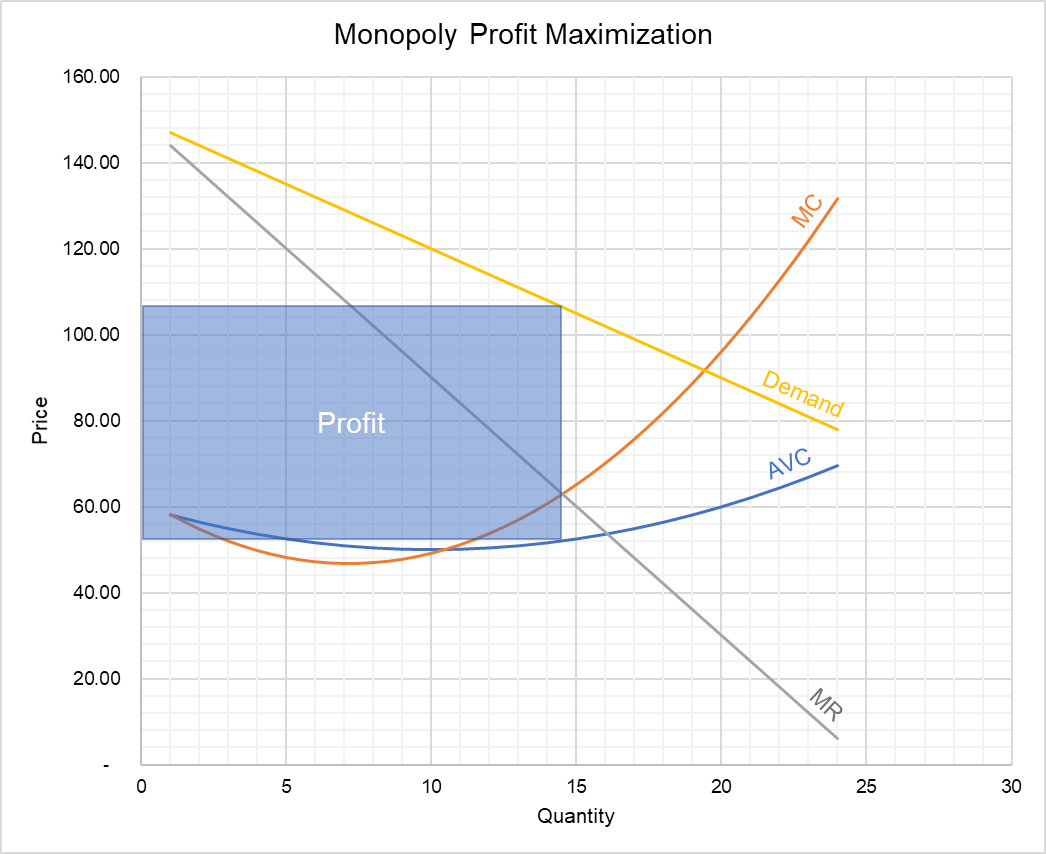
The marginal revenue curve intersects the marginal cost curve at 14 units which corresponds to a price that is between $105 and $110. The blue-shaded area represents the monopolist’s profit.
We can refine our results using the other method i.e. the mathematical approach. We need to write expression for MR = MC and then solve for Q:
$$ \ \text{150}\ -\ \text{6Q}=\ \text{0.3Q}^\text{2}-\ \text{4Q}+\text{60}\ $$
In the above expression, Q = 14.3. By plugging the value of Q in the demand function, we get price P = $107.
$$ \text{P}\ =\ \text{150}\ -\ \text{3}\times\text{14.3}=\text{\$107} $$
You can verify that at this output MR = MC = 64.17. Hence, the profit-maximizing condition is met.
by Obaidullah Jan, ACA, CFA and last modified on