Marginal Cost
In economics, marginal cost is the incremental cost of additional unit of a good. It equals the slope of the total cost function. The marginal cost curve is generally U-shaped.
Of all the different categories of costs discussed by economists, including total cost, total variable cost, total fixed cost, etc., marginal cost is arguably the most important. It is because it directly affects a firm’s production decision. Firms compare marginal revenue of a unit sold with its marginal cost and produce it only if the marginal revenue is higher or equal to the marginal cost.
Marginal cost can be calculated directly by subtracting total cost of Q – 1 units from total cost of Q units. This can be written mathematically as follows:
MC = TCQ − TCQ−1
Since equal amount of fixed costs is included in TCQ and TCQ – 1, if we subtract FC from both sides, we can define marginal cost as the difference between total variable cost at Q units minus total variable cost at Q – 1 units
MC= VCQ − VCQ − 1
Marginal cost is the change in total cost (or total variable cost) in response to a one unit change in output. It equals the slope of the total cost curve/function or the total variable cost curve. As the slope of any function can be determined by finding its first derivative, MC can also be defined as follows:
| MC = | dTC | = | dVC |
| dQ | dQ |
Example
Assume you work as analyst at a firm whose total cost curve is given by the following equation:
TC = 0.1Q3 − 2Q2 + 60Q + 200
When Q = 0, total cost TC equals $200 and this is the total fixed cost. Using the function above and the information about fixed costs, we can create the following cost table:
| Q | TC | VC | AVC | MC |
|---|---|---|---|---|
| 1 | 258.10 | 58.10 | 58.10 | 58.10 |
| 2 | 312.80 | 112.80 | 56.40 | 54.70 |
| 3 | 364.70 | 164.70 | 54.90 | 51.90 |
| 4 | 414.40 | 214.40 | 53.60 | 49.70 |
| 5 | 462.50 | 262.50 | 52.50 | 48.10 |
| 6 | 509.60 | 309.60 | 51.60 | 47.10 |
| 7 | 556.30 | 356.30 | 50.90 | 46.70 |
| 8 | 603.20 | 403.20 | 50.40 | 46.90 |
| 9 | 650.90 | 450.90 | 50.10 | 47.70 |
| 10 | 700.00 | 500.00 | 50.00 | 49.10 |
| 11 | 751.10 | 551.10 | 50.10 | 51.10 |
| 12 | 804.80 | 604.80 | 50.40 | 53.70 |
| 13 | 861.70 | 661.70 | 50.90 | 56.90 |
| 14 | 922.40 | 722.40 | 51.60 | 60.70 |
| 15 | 987.50 | 787.50 | 52.50 | 65.10 |
| 16 | 1,057.60 | 857.60 | 53.60 | 70.10 |
| 17 | 1,133.30 | 933.30 | 54.90 | 75.70 |
| 18 | 1,215.20 | 1,015.20 | 56.40 | 81.90 |
| 19 | 1,303.90 | 1,103.90 | 58.10 | 88.70 |
| 20 | 1,400.00 | 1,200.00 | 60.00 | 96.10 |
If we plot the average variable cost (AVC) and the marginal cost (MC) value, we get the following graph:
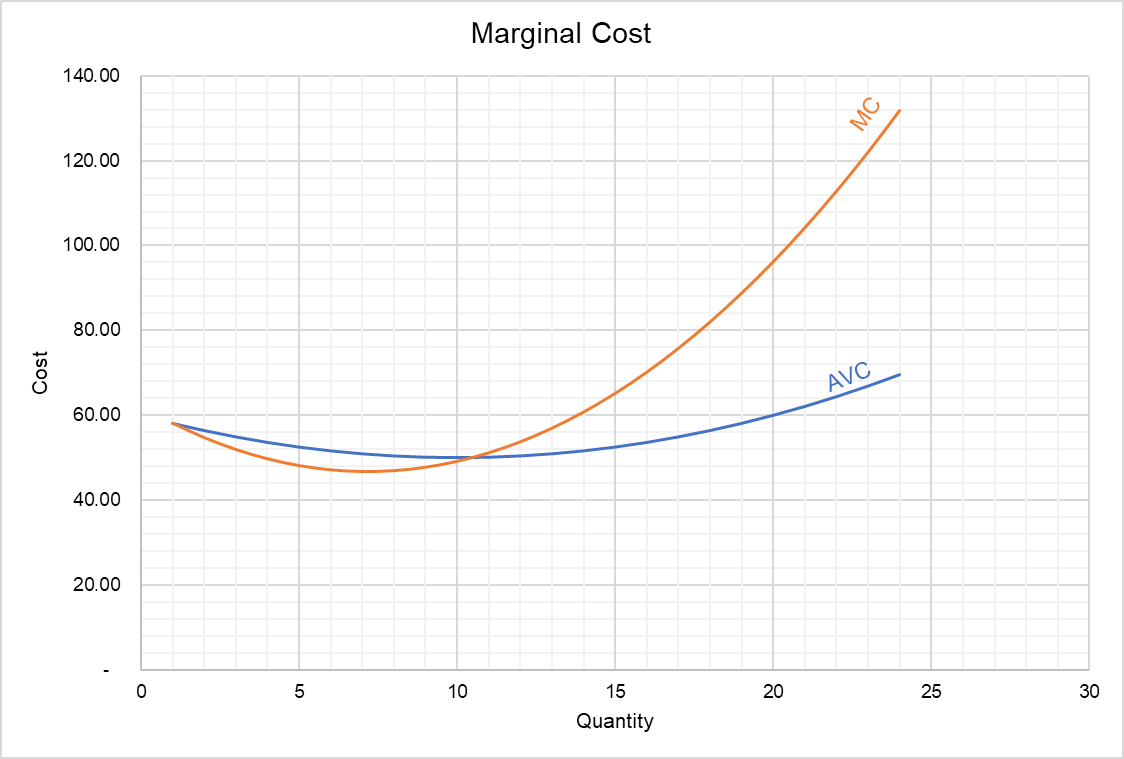
Relationship between MC and AVC
The following general relationship exists between marginal cost curve and other cost curves:
- As long as the marginal cost curve lies below the average cost curve, the average cost decreases and the average cost curve declines, but as soon as the marginal cost curve crosses the AVC curve, average cost starts to rise.
- Marginal cost is equal to the average variable cost when the average variable cost is at its minimum. It means that MC curve crosses AVC curve at its minimum point.
Calculating Marginal Cost using Calculus
Instead of creating the table we did in the example above, we can calculate marginal cost of a unit directly using calculus.
Since marginal cost equals the slope of the total cost curve (or the total variable cost curve), it equals the first derivative of the total cost (or variable cost) function.
| MCQ = | dTC | = 0.3Q2 − 4Q + 60 |
| dQ |
If we want to find the marginal cost of 15th unit, all we need to do is to plug 15 in place of Q is the formula above:
MC15
= 0.3 × 152 − 4 × 15 + 60
= 65.10
The value worked out using calculus differs from the value calculated conventionally because the first derivative provides the instantaneous rate of change of the cost function instead of average change in cost from 14th to 15th unit.
by Obaidullah Jan, ACA, CFA and last modified on