Law of Diminishing Marginal Utility
Law of diminishing marginal utility states that as we consume more and more of a good, the contribution of each additional unit to our total utility is less than the contribution of the unit consumed before it.
Utility is a central concept in economics that refers to the satisfaction or value that we obtain from consumption of a product. It is an abstract quantification of benefits and its (hypothetical) unit is util. Marginal utility is the increase in total utility that results from consumption of each additional unit. Marginal utility of the nth unit (MUn) equals total utility derived from consumption of n units (Un) minus total utility derived from consumption of n – 1 units (Un-1) as show below:
MUn = Un − Un-1
The law of diminishing marginal utility suggests that as n gets larger, MU will get smaller and it makes intuitive sense. If you have taken up four subjects in your current semester, you will allocate your time and effort to different subjects based on how interesting you find each subject, how much marks it carries on your final exam, etc. In doing her eleventh-hour revision, a rational student would allocate her precious time between subjects in the descending order of the potential improvement in score on the subject per hour of study. It would be unwise to spend all the time on practicing just one subject. It is all consistent with the law of diminishing marginal utility i.e. the improvement in knowledge (i.e. utility) decreases as more and more time is allocated to one subject.
Example
Matt is an intelligent and methodical student. He conducted a survey of his classmates asking them how many days in the last month of their exam preparation vacations they allocated to economics, their scores and how well they felt while studying. He defined utility by weighting the scores on the exam and inherent satisfaction ranking and populated the following table:
| Days | Utility | Marginal Utility |
|---|---|---|
| 1 | 20.00 | 20.00 |
| 2 | 31.00 | 11.00 |
| 3 | 41.00 | 10.00 |
| 4 | 50.00 | 9.00 |
| 5 | 58.00 | 8.00 |
| 6 | 65.00 | 7.00 |
| 7 | 71.00 | 6.00 |
| 8 | 76.00 | 5.00 |
| 9 | 80.00 | 4.00 |
| 10 | 83.00 | 3.00 |
| 11 | 85.00 | 2.00 |
| 12 | 86.00 | 1.00 |
| 13 | 86.50 | 0.50 |
| 14 | 86.75 | 0.25 |
| 15 | 86.75 | - |
It shows that the first day spent studying is the most useful and each additional day is less so. The data is plotted as below:
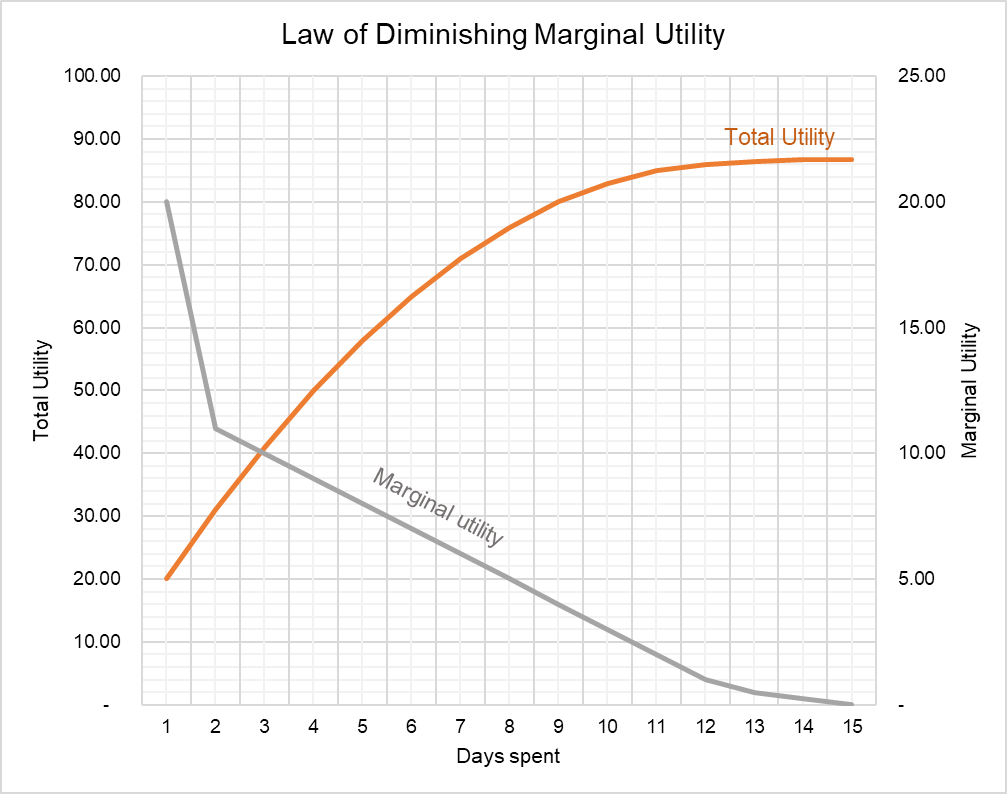
The orange line is the curve for total utility i.e. it plots total utility corresponding to total time. It rises but the rate of assent falls till the curve flattens out. The flattening out of the curve corresponds to the diminishing marginal utility. The same point is illustrated by the downward-sloping grey curve that plots marginal utility.
by Obaidullah Jan, ACA, CFA and last modified on