Engel Curve
An Engel curve is a graph which shows the relationship between demand for a good (on x-axis) and income level (on y-axis). If the slope of curve is positive, the good is a normal good but if it is negative, the good is an inferior good.
One of the determinants of demand is consumer income. A change in income can cause a shift in demand curve. In case of a normal good, an increase in income increases demand and causes an outwards (right-ward) shift in the demand curve. But in case of an inferior good, an increase in income decreases demand and shifts the demand curve inwards (left-ward). This is how an Engel curve shows whether a good is a normal good or inferior good.
Engel curve and income elasticity of demand
Since in case of a normal good, quantity demand increases with increase in income, it causes the Engel curve to have a positive slope. On the other hand, in case of an inferior good, the Engel curve has negative slope.
Engel curves are also related to the income elasticity of demand: where the income elasticity of demand is positive, Engel curves slope upwards and where the income elasticity of demand is negative, Engel curve slopes downwards.
Example
The following table shows Mark’s monthly income and his monthly demand for hamburger and steaks:
| Monthly Income | Hamburgers | Steaks |
|---|---|---|
| 1,000 | 4 | 2 |
| 1,500 | 6 | 3 |
| 2,000 | 8 | 4 |
| 2,500 | 10 | 5 |
| 3,000 | 12 | 6 |
| 3,500 | 10 | 7 |
| 4,000 | 8 | 8 |
| 4,500 | 6 | 9 |
| 5,000 | 4 | 10 |
If we plot income on y-axis and quantity on each item, we get the following graph:
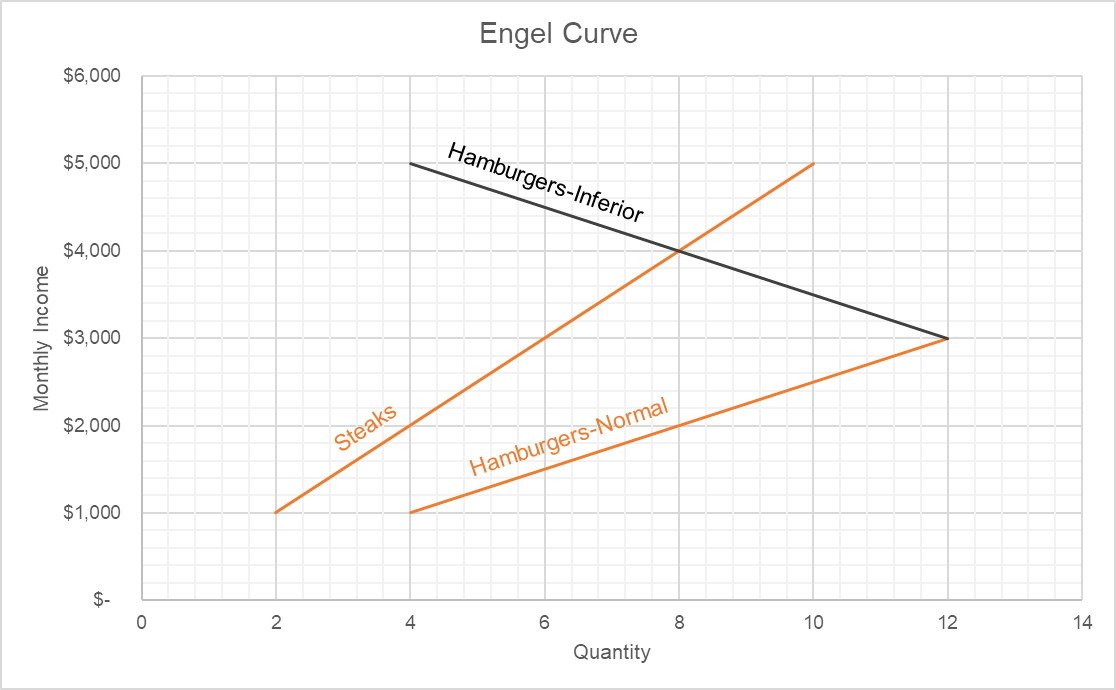
Interpretation
You can see that monthly demand for steaks increases consistently with increase in income. This is shown by the positive-sloped Engel curve. We can verify that steaks have positive income elasticity of demand at all points.
In case of hamburgers, it is a different story. When income increases from $1,000 per month to $3,000, demand for hamburgers increase. This shows that in this income range, hamburgers have a positive income elasticity of demand and upward-sloping Engel curve which show that they are a normal good in this income range.
Back-ward bending Engel curve
However, as soon as income rises above $3,000 per month, Engel curve bends backward i.e. it starts to slope negatively. It is because at income level above $3,000, demand for hamburgers start to fall. It may be because Mark switches to healthier but costlier food because he can now afford it.
by Obaidullah Jan, ACA, CFA and last modified on