Indifference Curve
An indifference curve is a graph of different combinations of two products to which a consumer is indifferent i.e. he likes both combinations equally likely.
Let’s consider Mark who wants to decide about number of dine-outs and number of movies in a month. He analyzed his consumption pattern over the last year and found out the following: (a) if he watches 2 movies in any month, he dines out 8 times, (b) if he watches 4 movies, he dines out 3 times and (c) if he watches 6 movies, he dines out 1 time and so on. He likes all the possibilities equally and has no preference for any single combination. If we plot these combinations on graph with movies on one axis and dine-outs on the other, we would get his indifference curve as shown below.
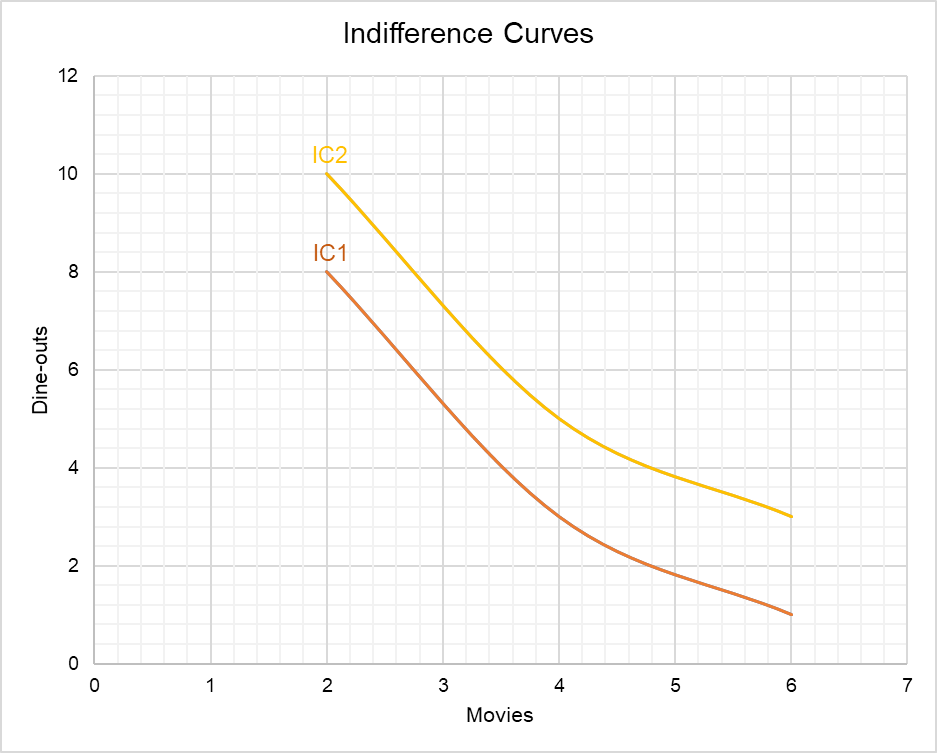
Obviously, Mark would prefer to watch 4 movies and dine out 4 times because this combination is better than all of the current combinations. It shows that a single consumer can have more than one indifference curve. Such a group of indifference curves that show the equally likeable alternatives for a consumer at difference income level is called a family of indifference curves. The outermost indifference curve IC2 has higher ranking because it offers more of both movies and dine-outs in all instances.
You must have noticed that there is a trade-off between both goods, i.e. as the number of movies increase, the number of dine-outs decrease and vice versa. The rate at which a consumer foregoes consumption of one unit of one product for the other is called the marginal rate of substitution (or substitution ratio).
Properties of Indifference Curves
Following are some important properties of indifference curves:
- The indifference curves do not slope upwards. It is because an indifference curve shows trade-off between two goods i.e. one must decrease if the other increases. If we have an upward-sloping indifference curve, it would mean that consumption of both goods can simultaneously increase.
- The outermost indifference curve is most preferred by a consumer and the ranking decreases as we move inwards i.e. towards left.
- Indifference curves do not intersect. It is because different indifference curves represent different affluence level and an intersection would mean that the consumer is indifference between product combinations represented by the two indifference curves.
Budget Constraint and Indifference Curves
A consumer’s budget constraint (also called budget line) is a straight line that shows the different combination of two products that the consumer can afford to buy.
Let’s consider Mark again. It he has a total of $200 to spend on movies and dine-outs, this is his budget constraint. If a movie costs $35 and a dine-out cost $20, we can determine his consumption possibilities. If he spends all his money on movies, he can afford to watch 5.7 movies (i.e. $200/$35). Alternatively, if he spends all the $200 on dine-outs, 10 dine-outs are possible ($200/$20). This information gives us two points to draw a budget line. It can be shown that the slope of indifference curve equals the price of a movie divided by price of a dine-out i.e. $35/$20 which in turn equals marginal utility of a movie divided by marginal utility of a dine-out.
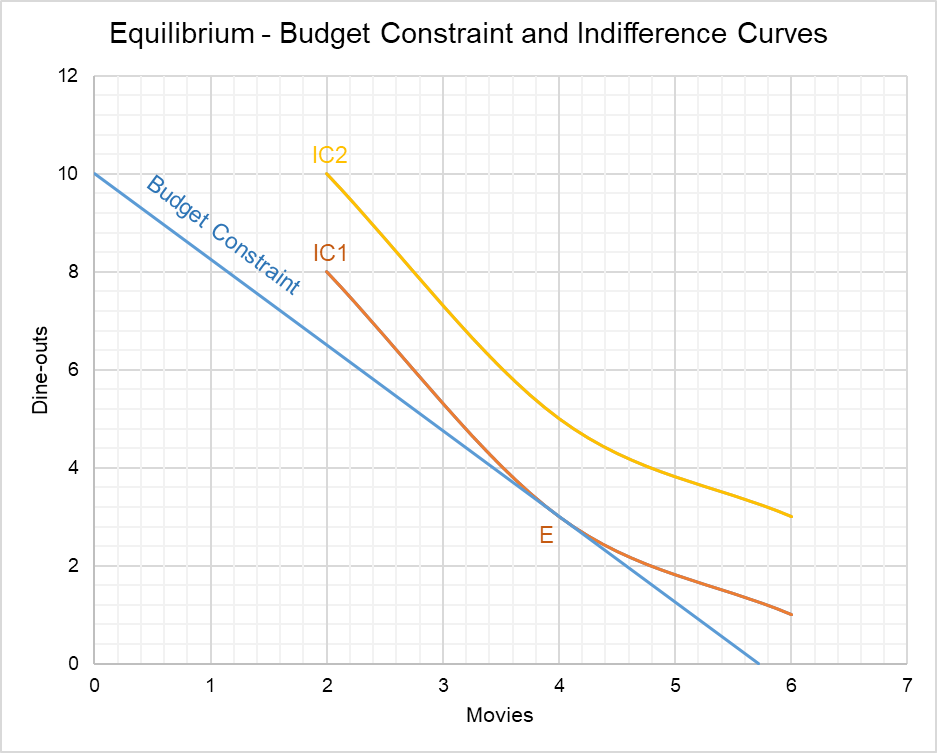
The point at which a consumer’s budget line is tangent to his indifference curve (i.e. Point E) is the combination he consumes.
The indifference curve analysis can be used to explain the substitution effect and income effect.
by Obaidullah Jan, ACA, CFA and last modified on