Shifts in Budget Line
A budget line shows the maximum consumption of a consumer at a given income level. It shifts parallelly when there is a change in income but rotates when the relative prices change.
A budget line is also called a budget constraint because it limits total consumption possibility of a consumer. Total consumption in dollars at all points on the budget line equals total income. If Product A is plotted on y-axis and Product B on x-axis, the budge line touches y-axis at a point at which all budget is spent on Product A and it touches x-axis at a point at which only Product B is consumed. At any point in between these two extreme cases, a combination of Product A and B are consumed.
A budget line can be represented using the following equation:
$$ \text{Q} _ \text{y}=\frac{\text{I}}{\text{P} _ \text{y}}-\frac{\text{P} _ \text{x}}{\text{P} _ \text{y}}\times \text{Q} _ \text{x} $$
Where Qy represents the units of the good on y-axis, Px and Py are the prices of the good on x-axis and y-axis respectively, and Px and Qx are the price and quantity of the good on x-axis. Px/Py is actually the slope of the budget line.
Change in Income: Parallel Shift
If there is a change in income of a consumer but there is no change in relative prices of the two goods, the budget line shifts parallelly i.e. the location of the new budget line is parallel to the initial one.
In other words, if there is a change in income but no change in relative prices, the ratio of the prices i.e. slope of the new budget line is the same as the slope of the initial budget line but its location changes.
When there is an increase in income, a consumer can buy more of both goods and this shows an outward i.e. rightward shift in the budget line. On the other hand, when there is a decrease in income, the consumer’s consumption possibility decreases, and the budget line shifts inwards.
Change in Relative Prices: Rotation
When there is a change in relative prices i.e. when price of only one good increase or when the price of one good increases by a larger percentage than the other, the budget line rotates i.e. it shifts but not parallelly.
The unparallel shift in budget line due to change in relative prices occurs because an unequal change in price causes a change in the slope of the budget line i.e. the ratio of prices.
The following example and graph illustrates the shift and rotation.
Example and Graph
Arya Stark is headed for Winterfell to meet Sansa and Jon Snow. She has 100 silver stag coins which she can spend on food for herself or supplies for her horse. If a unit of food costs 10 stags and a unit of supplies costs 5 stages, either of the following combinations are possible (let’s call this budget line X):
| Combination | Food | Supplies | Total Spending |
|---|---|---|---|
| A | 10.00 | 0.00 | 100 |
| B | 7.50 | 5.00 | 100 |
| C | 5.00 | 10.00 | 100 |
| D | 0.00 | 20.00 | 100 |
If she loses 50 stags, her new consumption possibility is tabulated below (let’s call this budget line Y):
| Combination | Food | Supplies | Total Spending |
|---|---|---|---|
| E | 5.00 | 0.00 | 50 |
| F | 3.75 | 2.50 | 50 |
| G | 2.50 | 5.00 | 50 |
| H | 0.00 | 10.00 | 50 |
If her money remains 100 stags but the price of supplies decreases to 3 stags, following combination of food and supplies are possible (let’s call this budget line Z):
| Combination | Food | Supplies | Total Spending |
|---|---|---|---|
| I | 10.00 | 0.00 | 100 |
| J | 7.50 | 8.33 | 100 |
| K | 5.00 | 16.67 | 100 |
| L | 0.00 | 33.33 | 100 |
Let’s plot all these budget lines as follows:
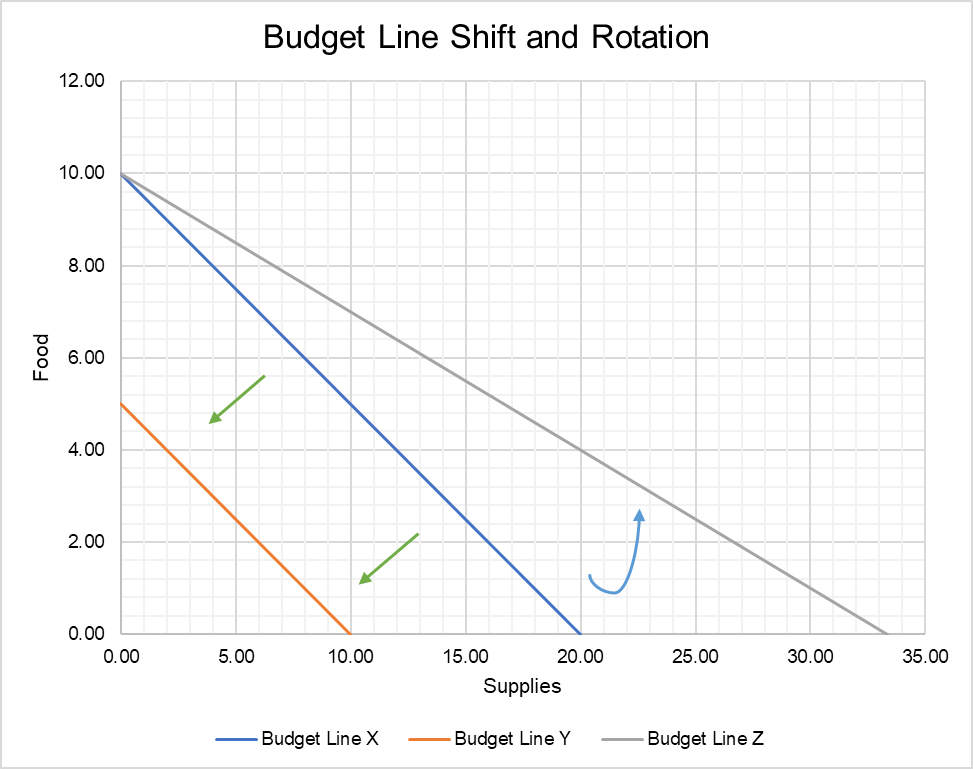
You can see that due to change in income/wealth, the budget line shifts downwards i.e. leftward from Budget Line X to Budget Line Y.
However, in response to a change in price of supplies, the budget line rotates from Budget Line X to Budget Line Z.
by Obaidullah Jan, ACA, CFA and last modified on