Price-Consumption Curve
Price-consumption curve is a graph that shows how a consumer’s consumption choices change when price of one of the goods changes. It is plotted by connecting the points at which budget line touches the relevant maximum-utility indifference curve.
Since consumers have limited income, they must choose their consumption basket keeping in view their budget constraint. A consumer’s budget line plots all such combinations of two goods which he can afford. There are two causes of a budget line shift: change in income or change in the relative price of goods in the consumption basket. When price of one good changes relative to others, it causes a rotation in the budget line.
Income-consumption curve is a similar graph which traces changes in demand in response to changes in income.
Example
Let’s consider Michael who has monthly income of $3,000, 7% of which he wants to spend on books. He wants to decide how many books he should buy in hardcover and how many in paperback. A paperback costs $20 and a hardcover costs $30.
Michael’s consumption budget is $210 (7% of $3,000) which he can use to buy 9 paperbacks (and 0 hardcovers) or 6 hardcovers (and 0 paperbacks) or any intermediate combination. This is represented by the budget line BL-1 in the graph below.
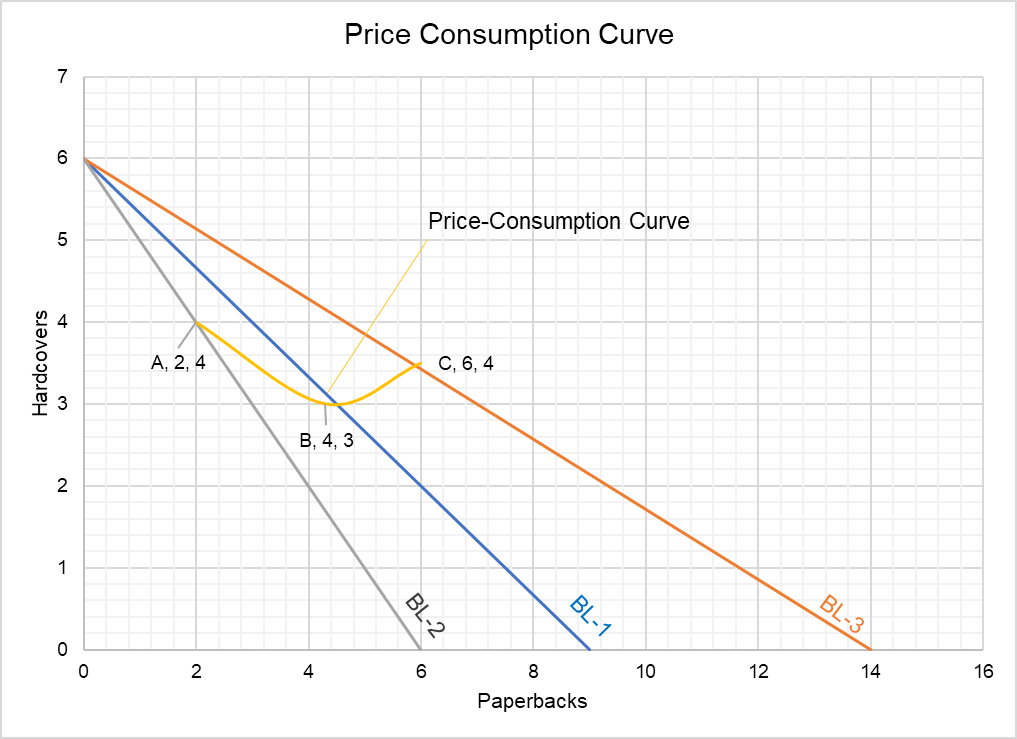
If the price of paperbacks fall to $15, Michael can now purchase more paperbacks (14 to be exact i.e. $210/$15) with the same budget. Alternatively, if the price increases to $30, Michael can no longer afford the same number of paperbacks. These price movements cause Michaels’ budget line to move along the x-axis as shown in the graph above.
When paperbacks become more experience, Michael’s budget line rotates from BL-1 to BL-2. This causes Michael to substitute more hardcovers for paperbacks such that his consumption choice (i.e. point of intersection of BL-2 and the relevant highest indifference curve) becomes Point A (corresponding to 4 hardcovers and 2 paperbacks). On the other hand, when paperbacks become cheaper and budget line moves from BL-1 to BL-3, consumption bundle switches from B to C.
by Obaidullah Jan, ACA, CFA and last modified on