Supply Function
A supply function is a mathematical expression of the relationship between quantity demanded of a product or service, its price and other associated factors such as input costs, prices of related goods, etc.
A supply function has single dependent variable (i.e. the quantity supplied) and many independent variables i.e. market price, price of related goods, input costs, etc. A supply equation can be formulated by studying the relationship between supply (the dependent variable) and the independent variables and determining whether the relationship is positively-related or negatively-related. For example, in general the supply and market price are inversely related. The same is the case with supply and input prices i.e. at higher input prices, supply is lower. On the other hand, supply and technological progress are inversely related, i.e. better technology means more supply, etc.
A supply function can be used to find out the expected quantities of a product which will enter the market if we know the market price, input costs and other variables. If we have a demand function and supply function for a market, we can solve them to find out the equilibrium price (i.e. the market clearing price) and the equilibrium quantity.
Example
Let’s consider the market for cabs in a city. Using historical data such as number of cabs, price per kilometer, price of fuel, lease costs of a car, etc. we can find out an equation using multiple regression analysis or other statistical techniques which links numbers of cabs (Q) to price per kilometer (P), fuel costs (F), fuel efficiency (E), lease costs of a cab (L), etc. Assume this is the equation that you arrived at:
$$ \text{Q}=\text{3,000}+\text{7,500}\times \text{P}\ -\ \text{1,500}\times \text{F}+\text{150}\times \text{E}\ -\ \text{3}\times \text{L} $$
It shows that the number of cabs available in the market are directly proportional to the fare per kilometer and cab fuel efficiency and inversely proportional to the fuel cost and leasing cost. This equation shows the effect of both a change quantity supplied and a shift in the supply curve.
Fuel costs (F), cab efficiency (E) and leasing costs (L) are determinants of supply which cause a shift in the supply curve inwards or outwards. If the current fuel costs are $1 per liter, current fuel efficiency is 15 km/l and current leasing costs are $400 per month, , we can simply the above supply equation to arrive at a relationship between number of cabs (Q) and fare per kilometer (P).
$$ \text{Q}=\text{3,000}+\text{7,500}\times \text{P}-\text{1,500}\times\text{\$1}+\text{150}\times\text{15}\ -\ \text{3}\times\text{400} $$
$$ \text{Q}=\text{2,550}+\text{7,500}\times \text{P} $$
It shows that with each one dollar increase in fare per kilometers, 7,500 additional cabs enter the market. This simplified equation represents a change in quantity supplied only in response to the change in fare per kilometer i.e. P.
The above equation can b used to determine the number of cabs that will exist in the market if the fare is (a) $1.75 and (b) $2.00:
$$ \text{Q} _ {\text{1.75}}=\text{2,550}+\text{7,500}\times\text{\$1.75}=\text{15,675} $$
$$ \text{Q} _ {\text{2.00}}=\text{2,250}+\text{7,500}\times\text{\$2.00}=\text{17,750} $$
Now, let’s assume, the new fuel cost is $1.50 per liter, the new supply will be determined using the expanded supply function because it involves a shift in the supply.
These equations can be used to plot the supply curve as shown below:
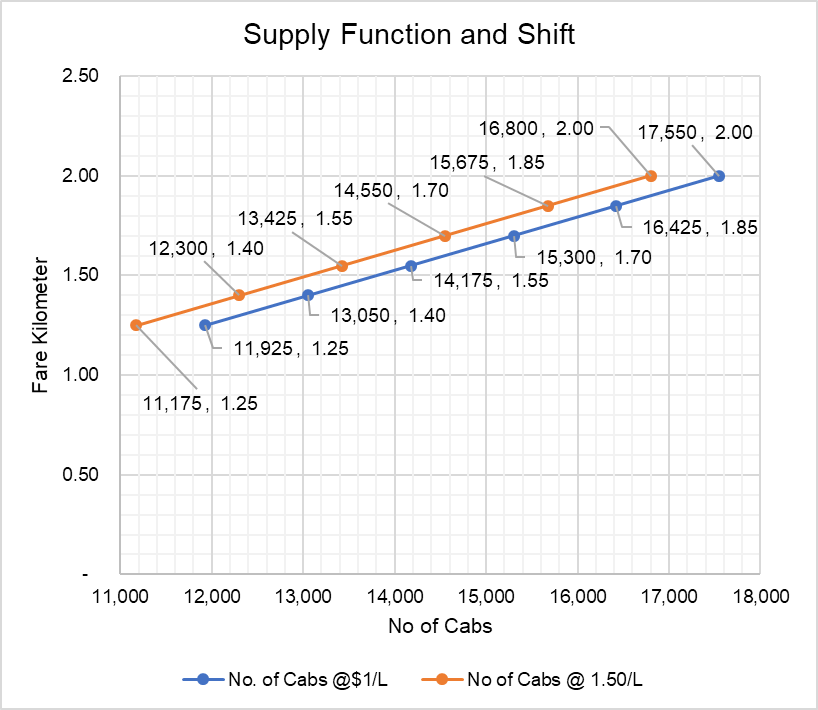
Please note the downward sloping supply curve, which is just in line with the law of supply.
The blue supply curve shows the relationship between number of cabs and fare per kilometer while the orange line also incorporates the effect of changes in fuel price. The orange supply curve has shifted inwards because fuel cost (i.e. input cost) has increased.
by Obaidullah Jan, ACA, CFA and last modified on