Quantity Supplied vs Supply
Quantity supplied is the quantity of a product which producers are willing to supply at a given price while change in supply refers to the overall shift in supply schedule due to technological changes, input prices, government regulations, etc.
A supply schedule or a supply curve refers to a plot of quantities supplied by the producer at different prices. The quantity supplied changes only in response to changes in the price of the product. When the whole supply curve shifts inwards or outwards i.e. it decreases or increases, it is referred to as a change in supply or a shift in supply curve.
Imagine you work as a financial analyst at a ride-hailing services. You want to determine the optimal number of driver partners to induct in a city. You conducted a survey to find out the number of people who are willing to sign-up as driver partners at different levels of fare per kilometer. The results are summarized below:
| Scenario | Charge per Kilometer | Driver Partners |
|---|---|---|
| A | 1.00 | 2,000 |
| B | 1.25 | 2,200 |
| C | 1.50 | 2,380 |
| D | 1.75 | 2,530 |
| E | 2.00 | 2,650 |
| F | 2.25 | 2,750 |
You expect the global fuel prices to drop by 30% and using some past data, you estimated that in case of the anticipated decrease in fuel prices, the supply will shift as follows:
| Charge per Kilometer | New Driver Partners |
|---|---|
| 1.00 | 2,400 |
| 1.25 | 2,640 |
| 1.50 | 2,856 |
| 1.75 | 3,036 |
| 2.00 | 3,180 |
| 2.25 | 3,300 |
The above supply schedules are plotted below:
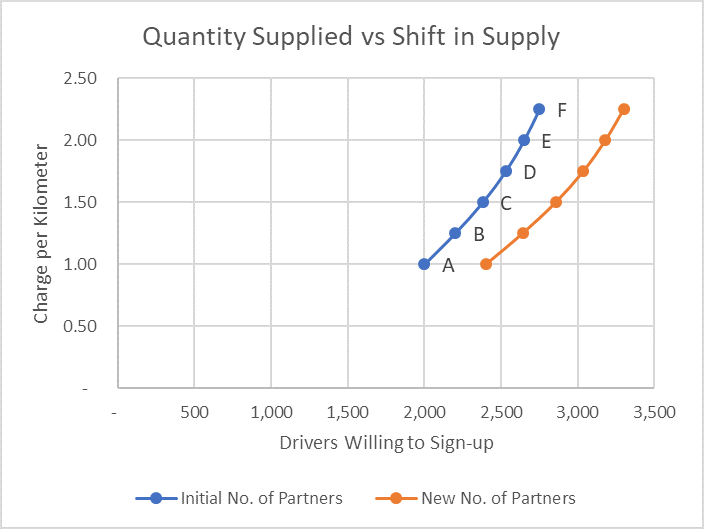
Change in Quantity Supplied
As you move from Point A to Point B on the blue curve i.e. the initial supply curve for driver partners, the price per kilometer increases by $0.25 and the number of drivers willing to sign-up increases by 200. If you move from Point E to F, the price per kilometer increases by $0.25 but the number of drivers increase by 100. This movement along the supply curve is reference to as change in quantity supplied. It is the change in number of driver partners that occur in response to the change in the charge per kilometer i.e. the price.
Shifts in Supply
However, when the fuel prices decrease, it increases the number of driver partners willing to sign up at each price. It is because due to a decrease in the inputs, it becomes more profitable to sign-up and drive and hence, more and more drivers are willing to sign-up. Such a change in supply (from the blue curve to the orange curve) in response to a change in external factors is referred to as a shift in supply. Factors that bring about such shift in supply are called determinants of supply. As illustrated above, change in input prices is one of them. In this example, other changes which will increase supply include (a) an improvement in efficiency of cars (i.e. improvement in technology), (b) an increase in general unemployment level (so more people are forced to consider the ride-hailing option), etc.
by Obaidullah Jan, ACA, CFA and last modified on