Market Clearing Price
Market clearing price is the price at which the quantity demanded of a product or service equals quantity supplied and no surplus or shortage exists in the market. It is the price that corresponds to the point of intersection of the demand curve and the supply curve.
A market demand curve plots the quantities of a product or service which consumers are willing and able to buy with reference to their prices. Similarly, the supply curve shows quantities which the supplier will make available in the market at different price levels. The demand curve is generally downward sloping which means that as the price decreases, the quantity demanded increases. On the other hand, the supply curve is upward sloping i.e. when price increases, the quantity supplied increases too.
If the quantity demanded exceeds the quantity supplied, it tends to increase the market price of the product which in turn decreases the quantity demanded until it matches the quantity supplied. The opposite applies when the quantity demanded is lower than the quantity supplied i.e. the market price falls and the quantity demanded increases to meet the quantity supplied (through a downward movement on the demand curve).
Example
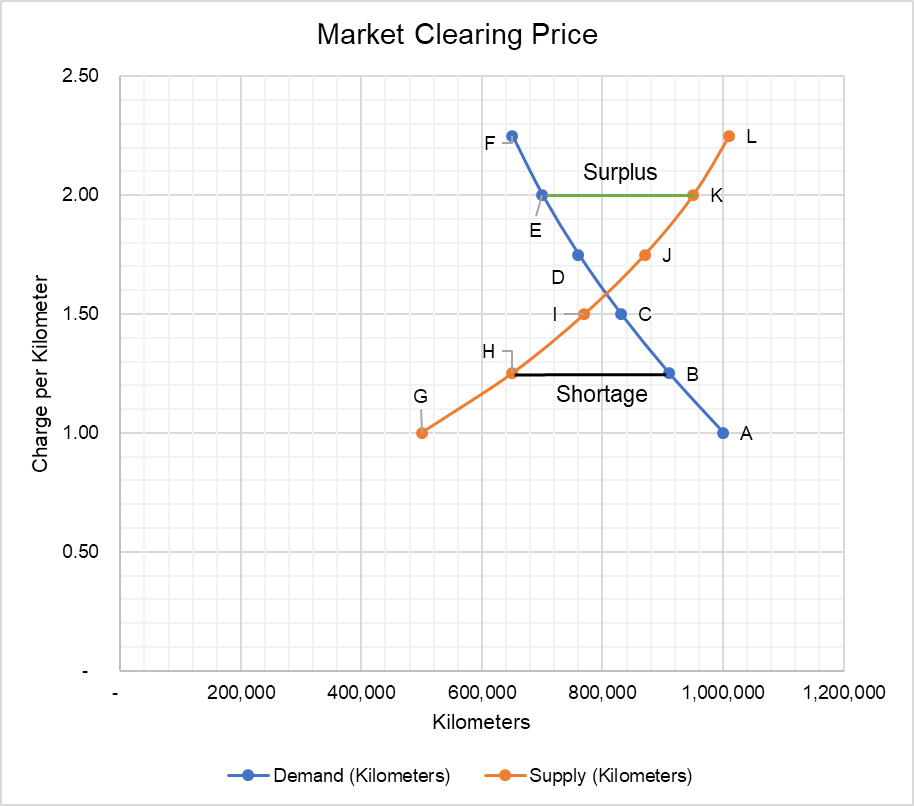
You work as a financial analyst at a ride-hailing app. Your company recently conducted a survey to find out the demand and supply situation for your product. The following demand and supply schedules show the number of kilometers that the riders demand and the number of kilometers the drivers are willing to supply at different prices per kilometer.
| Charge per Kilometer | Demand (Kilometers) | Supply (Kilometers) |
|---|---|---|
| 1.00 | 1,000,000 | 500,000 |
| 1.25 | 910,000 | 650,000 |
| 1.50 | 830,000 | 770,000 |
| 1.75 | 760,000 | 870,000 |
| 2.00 | 700,000 | 950,000 |
| 2.25 | 650,000 | 1,010,000 |
The following chart shows demand curve and supply curve and the market equilibrium point.
Market surplus/shortage
In the first week of the launch, 3,167 drivers signed up as partners (offering a capacity of 950,000 kilometers per day) and you set the charge per kilometer at $2. At this price they could manage to drive for only 700,000 kilometers because this is what the riders demanded. This miss-match between the quantity supplied and quantity demanded represents a market surplus. It is the difference between Point K and Point on the graph above.
In the second week, you reduced the price to $1.25 prompting a sudden exit of many drivers thereby dropping supply to only 650,000 kilometers. This excess of quantity demanded over quantity supplied represents a market shortage. On the graph above, this is represented by the difference between Point B and H.
Market clearing price & market equilibrium
Realizing the existence of market shortage, you adjusted the price up until you reached a price per kilometer at which quantity supplied and quantity demanded were exactly equal i.e. $1.57. At this price, enough drivers were willing to drive to cater to riders willing to pay this price. Hence, it is referred as to the market clearing price. This is the point of market equilibrium. It can be determined by plotting the supply curve and demand curve and find their point of intersection. Alternatively, it can be determined by solving the supply and demand equations.
by Obaidullah Jan, ACA, CFA and last modified on