Excel FVSCHEDULE Function
FVSCHEDULE is an Excel function that calculates future value of a single sum based on an array of interest/growth rates.
While FV function can be used to find future value at a single compound interest rate over multiple periods, it can't be used to find future value where we have to deal with different compound interest rate in different periods. FVSCHEDULE comes handy in such situations.
Let's say you want to find the value of John D. Rockefeller's wealth in today's dollars. He was worth $900 million in 1913. So, how do you calculate his net worth in today’s dollars? Easy! you add up inflation rate each year from 1913 to 2017, add 1 and multiply the resulting figure with $900 million. Wrong! You are cheating him of the compounding effect, the actual driver of time value of money. You need to multiply $900 million with (1 + inflation rate in 1914) multiplied by (1 + inflation rate in 1915) multiplied by (1 + inflation rate in 2016) and so on until you have multiplied together all one plus inflation rates. However, it is a torture to have to manually do it let alone the risk of error and the cumbersomeness of the formula. This is exactly why the guys at Excel came up with FVSCHEDULE function which allows you to grow a value A based on a schedule of growth rates.
Syntax
FVSCHEDULE has the following syntax:
FVSCHEDULE (principal, schedule)
Principal is the sum at t=0 which you want to grow based on the interest rates given in the Schedule
Example
You are an economist looking to work out GDP per capita of Wadia. The current GDP is 15 billion Wadiyan Dinar and the country’s population is 1 million. Aladeen, the country’s supreme leader has targeted a population growth rate of 10%, 20%, 30%, 40%, 50%, 60%, 70%, 80%, 90% and 100% over the next ten years while GDP is expected to grow by 1% each year over the next 10 years.
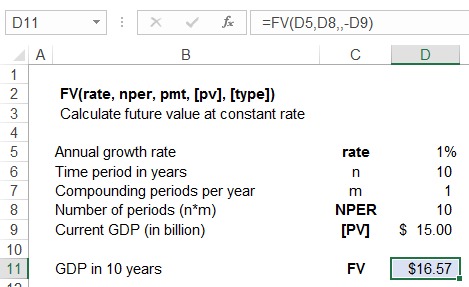
You first need to work out the expected future value of GDP. Since the growth rate is constant, you can use FV function:
We can’t use FV function to calculate population in 10 years because growth rate each year is different. However, we can use FVSCHEDULE function:
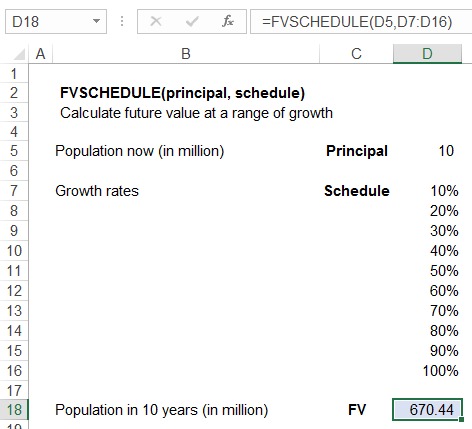
GDP per capita after 10 years of Aladeen’s rule would be $24.71 (=$16.57 billion divided by 0.67044 billion).
by Obaidullah Jan, ACA, CFA and last modified on