PVGO
PVGO stands for present value of growth opportunities and it represents the component of a company’s stock value that corresponds to the investors’ expectations of growth in earnings. PVGO can be calculated as the difference between the value of a company minus the present value of its earnings assuming zero growth. It is also called value of growth.
A company’s future earnings can be bifurcated into two layers: the first layer representing the current earnings forming a perpetuity and a second layer representing the growth that will occur in earnings over the future periods.
The following graph illustrates the two components:
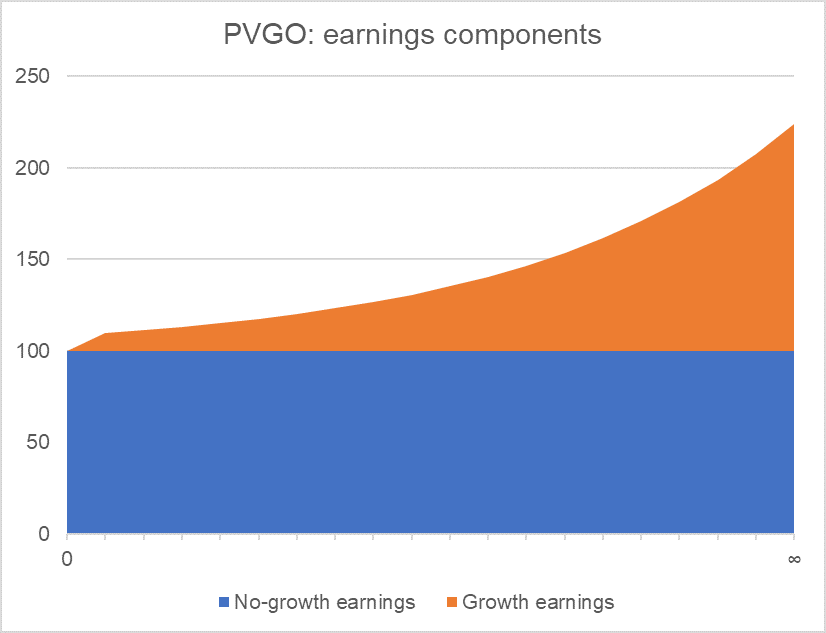
The blue section represents the future earnings volume if current earnings are projected on a straight-line basis forever. The orange section represents total volume of future increase in earnings. If there is a fall in earnings, the orange section will eat out some portion of the blue section.
PVGO is the present value of the orange section in the above graph.
Formula
The total value of a company (V0) equals the present value of its no-growth earnings plus the present value of growth opportunities (PVGO):
V0 = PVNG + PVGO
Where PVNG is the present value of no-growth earnings, i.e. the present value of the straight-line revenue stream. The straight-line revenue stream forms a perpetuity whose present value equals the next year earnings (E1) divided by the cost of equity (ke).
| V0 = | EPS1 | + PVGO |
| ke |
By rearranging the expression, we get the following equation for PVGO:
| PVGO = V0 − | EPS1 |
| ke |
The equation gives us the absolute value of PVGO in total terms or in per-share terms. PVGO can also be expressed as a proportion of PVGO to total value V0. A higher percentage of PVGO to V0 means that more of the company’s present value results from expectation of growth in the company’s earnings.
A low PVGO may have several reasons: (a) either increased competition, (b) high dividend payout, (c) inaccurate estimation of straight-line revenues, (d) increased maturity in the industry, etc.
Example
Let’s say the risk-free rate is 4% and the market risk premium is 8%, calculate ratio of PVGO to price for the following stocks:
| Company | Beta | Next year EPS | Current Price (P0) |
|---|---|---|---|
| Amazon | 1.72 | 6.89 | 1609.08 |
| 0.77 | 8.01 | 185.53 | |
| Walmart | 0.46 | 4.61 | 82.69 |
| Intel | 0.98 | 3.05 | 54.98 |
We need to work out the cost of equity and use it to find the present value of constant earnings stream and work out PVGO as the difference between stock price and PV of constant earnings.
Using the capital asset pricing model, cost of equity equals risk-free rate plus the product of beta coefficient and market risk premium. In case of Amazon, cost of equity (r) works out to 17.76% (=4% + 1.72 × 8%). The cost of equity for the remaining stocks can be calculated using the same method.
| Company | Beta | Cost of Equity (ke) | Next year EPS (EPS1) | EPS1/ke | Current Price (P0) | PVGO | PVGO/P0 |
|---|---|---|---|---|---|---|---|
| Amazon | 1.72 | 17.76% | 15.04 | 84.68 | 1609.08 | 1,524.40 | 95% |
| 0.77 | 10.16% | 8.01 | 78.88 | 185.53 | 106.65 | 57% | |
| Walmart | 0.46 | 7.68% | 4.61 | 60.08 | 82.69 | 22.61 | 27% |
| Intel | 0.98 | 11.84% | 3.05 | 25.80 | 54.98 | 29.18 | 53% |
You can see that the companies in IT, the high growth industry have higher PVGO/P proportions as compared to Walmart. Amazon has the highest growth potential and Intel being in a relative more mature sub-segment of the industry has lower PVGO.
by Obaidullah Jan, ACA, CFA and last modified on