Excel XNPV Function
XNPV function, which is an Excel function that calculates net present value of a stream of net cash flows of an investment given a discount rate and a schedule of dates on which the cash flows occur.
The standard Excel NPV function calculates net present value under the assumption that cash flows are equidistant i.e. there is equal duration between each cash flow and that they occur at the end of each period. While this assumption is a useful simplification, if you want to calculate net present value based on the exact dates on which cash flows are received, you must use XNPV function.
XNPV is a sister funciton of XIRR.
Syntax
XNPV syntax is:
XPNV(rate, values, dates)
Rate refers to the cost of capital at which the cash flows are discounted to t=0. Values argument refers to the stream of net cash flows of an investment or project under consideration and dates argument refers to the array of dates on which the cash flows occur.
The following screenshot illustrates use of XNPV function:
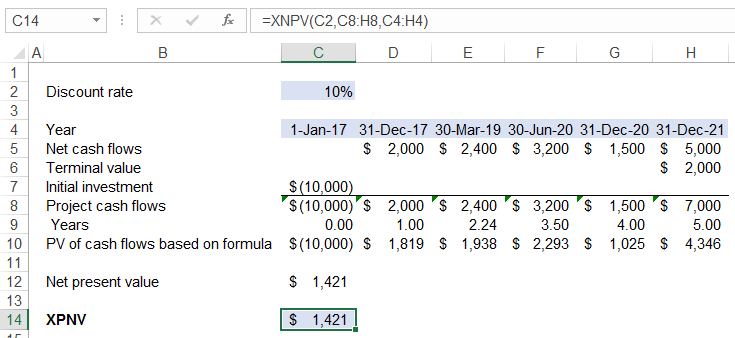
Excel works out the number of years between two cash flows based on a 365-days year.
XNPV function assumes the first cash flow to occur at t=0 so it doesn’t discount the first cash flow. Unlike NPV function, we must include the initial investment under the values argument in the XNPV function and hence not subtract it manually.
In case of NPV function, we include only the future cash flows in the values argument and then manually subtracted the initial investment because including the initial investment within the function would have discounted the initial investment too. In case of XNPV, since Excel assumes the first date with negative cash flow to be time 0, it doesn’t discount the first cash flow and calculates the number of years with reference to the first date i.e. the date of initial investment.
At Row 9, we have manually calculated the number of years each cash flow takes with reference to first date and calculated the resulting present value of each cash flow at 10% discount rate per annum at Row 8.
by Obaidullah Jan, ACA, CFA and last modified on