Crossover Rate
Crossover rate is the cost of capital at which the net present values of two projects are equal. It is the point at which the NPV profile of one project crosses over (intersects) the NPV profile of the other project.
Crossover rate is useful in capital budgeting analysis because it tells the investing company about the cost of capital at which both of the mutually-exclusive projects are equally good. If the company's cost of capital crosses the crossover rate, the relative attractiveness of mutually-exclusive projects changes i.e. if Project A is preferable at a discount rate below the crossover rate, Project B becomes feasible as soon as the cost of capital crosses the crossover rate.
Formula and Calculation
Assume first project has initial investment A and its cash flows at end of year 1, 2 and 3 are CF1, CF2 and CF3, we can develop its net present value equation as follows:
| NPV1 = | CF1 | + | CF2 | + | CF3 | − A |
| (1 + r)1 | (1 + r)2 | (1 + r)3 |
If second project has initial investment B and its cash flows are CFi and CFii, its net present value equation would look like:
| NPV2 = | CF1 | + | CF2 | − B |
| (1 + r)1 | (1 + r)2 |
Since crossover rate is the rate at which NPVs of two projects are equal, we can find it by equating NPV equation for the first project with NPV equation for the second project and then solving it for r.
A shorter approach to calculate crossover rate involves the following steps (as illustrated in the example):
- Determine the cash flows stream of first project and second project.
- Find the difference between initial investments of both projects and between each periodic cash flows.
- Develop an IRR equation by equating the net present value equation of the resulting differential cash flows to zero.
- Solve the equation for r.
Example
Wayne Enterprises is considering investing in two projects. The first project is the Tumbler project which is expected to cost $50 million and will result in cash flows of $60 million, $40 million and $20 million at the end of 1st, 2nd and 3rd year. The second project is the Bat project which is expected to cost $80 million but it is expected to generate economic benefits of $250 million at the end of 3rd year. Find the crossover rate.
Subtracting all the cash flows of project Tumbler from Project Bat gives us the following cash flows stream:
Initial cash outflows = $80 million − $50 million = $30 million
Cash flows at end of year 1 = 0 − $60 million = −$60 million
Cash flows at end of year 2 = 0 − $40 million = −$40 million
Cash flows at end of year 3 = $250 million − $20 million = $230 million
An IRR equation can be developed from the given stream. It would look like:
| 0 = | -60M | + | -40M | + | 230M | − 30M |
| (1 + r)1 | (1 + r)2 | (1 + r)3 |
Solving the above equation for r gives us a figure of 33.02%. This is the crossover rate.
The point of intersection in the following graph is the crossover rate.
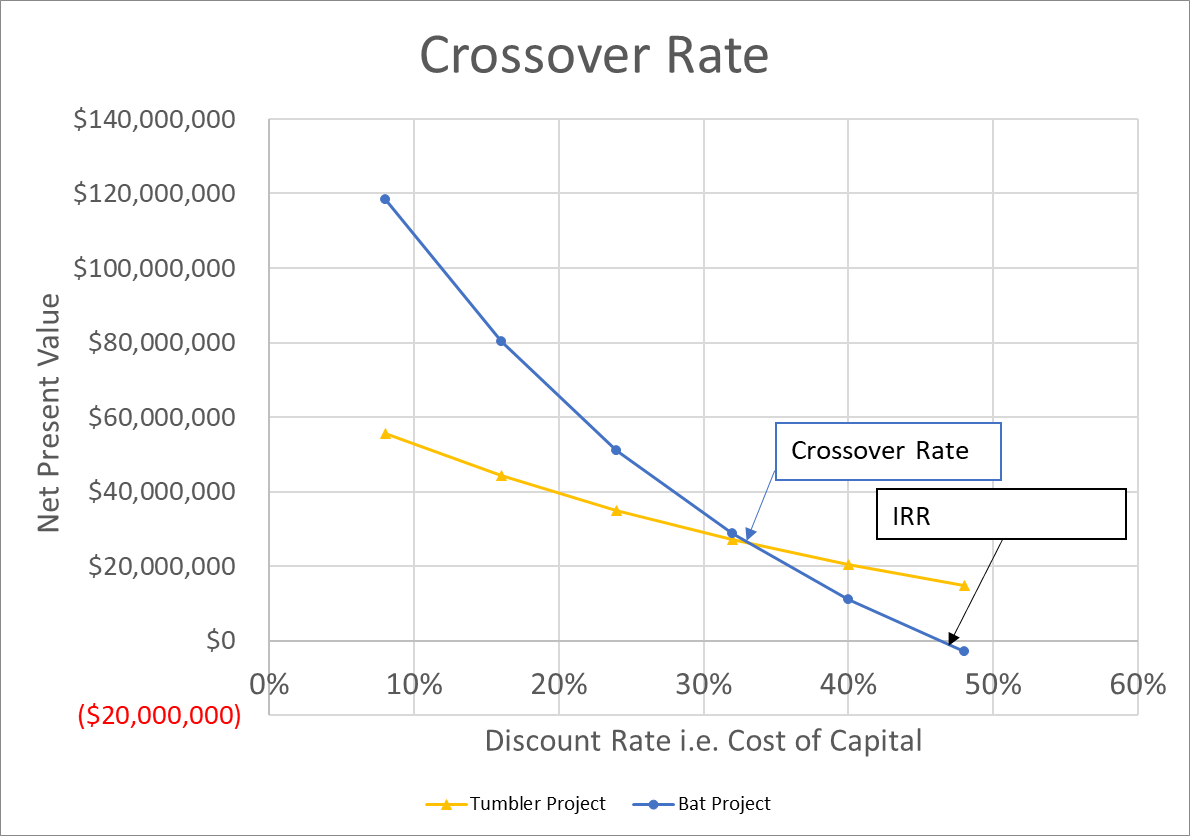
Bat project is preferable when the cost of capital is below 33.02%. However, if the cost of capital exceeds 33.02%, the Tumbler project will have higher net present value.
The point at which the NPV profile of a project intersects the x-axis i.e. when its NPV is zero, is the internal rate of return.
by Obaidullah Jan, ACA, CFA and last modified on