NPV Profile
NPV profile of a project or investment is a graph of the project’s net present value corresponding to different values of discount rates. The NPV values are plotted on the Y-axis and the WACC is plotted on the X-axis.
The NPV profile shows how NPV changes in response to changing cost of capital. The point at which the NPV curve intersects the Y-axis i.e. the cost of capital axis is the internal rate of return of the project and where NPV profiles of any two projects are plotted together, their point of intersection is called the crossover rate.
Example
Let’s say you have a project that requires initial investment of $10 million and will generate net cash flows of $3.5 million in each of the next 5 years. If we want to see how sensitive the project’s net present value is to the discount rate, we need to find NPV values for different discount rates say 4%, 8%, 12%, 16% and 20%.
NPV of the project at 4% discount rate can be determined as follows:
| NPV4% | ||
| = $3,500,000 × | 1 − (1 + 4%)-5 | − $10,000,000 |
| 4% | ||
| = $5,581,378 | ||
Using the same equation, we can find out NPV values of the project for other discount rates:
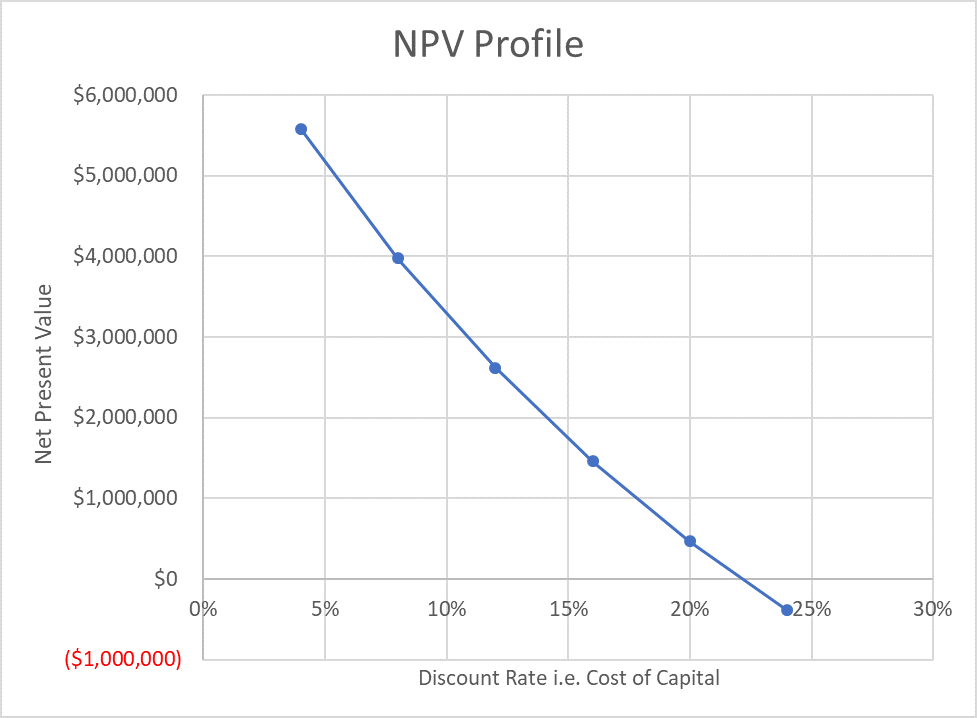
| Discount Rate | NPV of Project 1 |
|---|---|
| 4% | $5,581,378 |
| 8% | $3,974,485 |
| 12% | $2,616,717 |
| 16% | $1,460,028 |
| 20% | $467,142 |
| 24% | ($391,155) |
The following graph is the NPV profile of the project:
Now, let’s say we have another project requiring initial investment of $5 million and generating cash flows of $2 million, $2.5 million and $3 million in each of the next three years respectively.
The NPV of the second project at 4% would be $1,901,457:
| NPV4% | ||||||
| = | $2.5m | + | $3.0m | + | $3.5m | − $5.0m |
| (1+4%)1 | (1+4%)2 | (1+4%)3 | ||||
| = $3,289,002 | ||||||
The following table shows NPV of the second project at different discount rates:
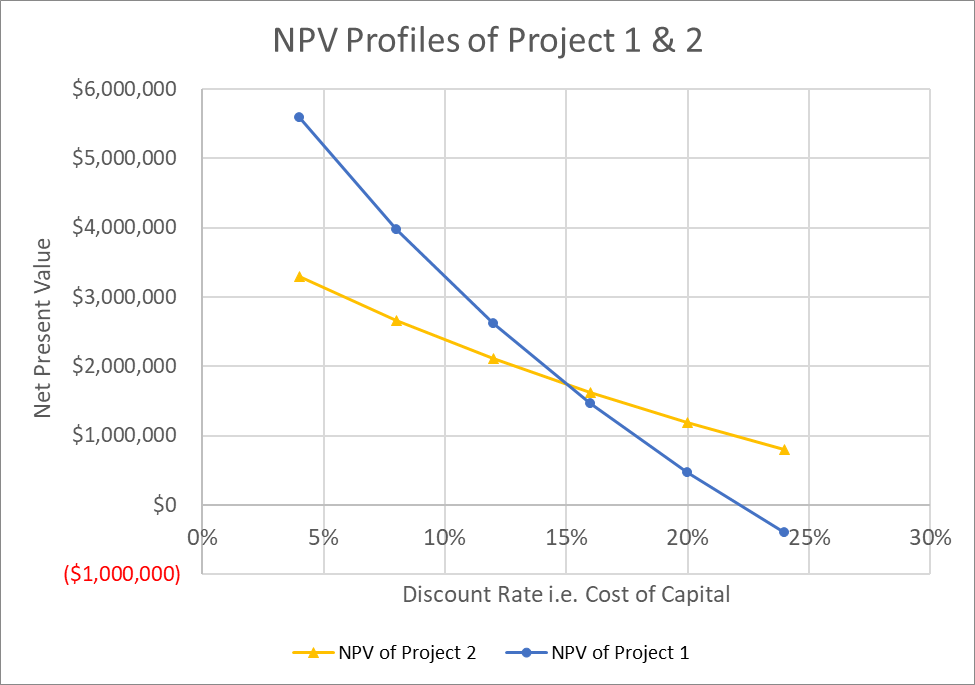
| Discount Rate | NPV of Project 2 |
|---|---|
| 4% | $3,289,002 |
| 8% | $2,665,244 |
| 12% | $2,114,955 |
| 16% | $1,626,963 |
| 20% | $1,192,130 |
| 24% | $802,927 |
If we plot the NPV profiles of both the projects, we can find their crossover rate, i.e. the discount rate at which an investor is indifferent between both the projects because their NPVs are equal.
by Obaidullah Jan, ACA, CFA and last modified on