Efficient Frontier
An efficient frontier is a graph that plots the expected return on a portfolio of investments on the y-axis and its risk as measured by its standard deviation on the x-axis. It demonstrates the risk-and-return trade-off of a portfolio and helps us visualize the efficient portfolios, the global minimum variance portfolio and inefficient portfolios.
In a portfolio, we can have a range of different combinations of the individual assets and the total portfolio return and standard deviation changes in response to any change in the asset allocation. The portfolio’s expected return is the weighted-average of the expected return of the individual investments and its variance and standard deviation depends on the weight of each asset, their individual standard deviation and their mutual correlation.
A risk-averse investor’s aim is to identify the mix of investments which yields the highest return for the lowest level of investment risk or exposes his to lowest level of risk for a given investment return. The efficient frontier plots portfolios that yields the same risk-return tradeoff. Any portfolio that falls below the efficient frontier is an inefficient portfolio because it is generating lower return per unit of risk. Such a graph is called the efficient frontier. The point on the efficient with the lowest standard deviation is called the minimum variance portfolio. On the same graph we can plot an investor’s utility function given his level of risk aversion. The point of intersection of the efficient frontier and the utility curve represent the portfolio allocation that is best suited given the risk-return trade-off and risk aversion of the investor.
The efficient frontier is based on standard deviation, a measure of total risk. However, because unique risk can be eliminated through diversification, we need to only worry about systematic risk. Beta coefficient is a measure of systematic risk and the capital asset pricing model, which estimates required return with reference to the risk-free rate and the market portfolio and the investment beta is a better model of risk-return.
Example
You are considering two assets, Asset A and Asset B, for investment. The following table shows your expectation of their expected return and standard deviation:
| Asset | E(R) | Standard Deviation |
|---|---|---|
| A | 12% | 6% |
| B | 8% | 4% |
Correlation coefficient between returns on both assets is expected to be 0.6
We can invest all our money in A or B or in some combination of A and B. The following table shows our portfolio’s expected return and standard deviation at different mix of A and B.
| Asset A Weight | Asset B Weight | Portfolio Standard Deviation | Portfolio Expected Return |
|---|---|---|---|
| 100% | 0% | 6.00% | 12.00% |
| 80% | 20% | 4.87% | 11.20% |
| 60% | 40% | 3.94% | 10.40% |
| 40% | 60% | 3.39% | 9.60% |
| 20% | 80% | 3.42% | 8.80% |
| 0% | 100% | 4.00% | 8.00% |
The results above can be plotted to get the following graph. It is called efficient frontier.
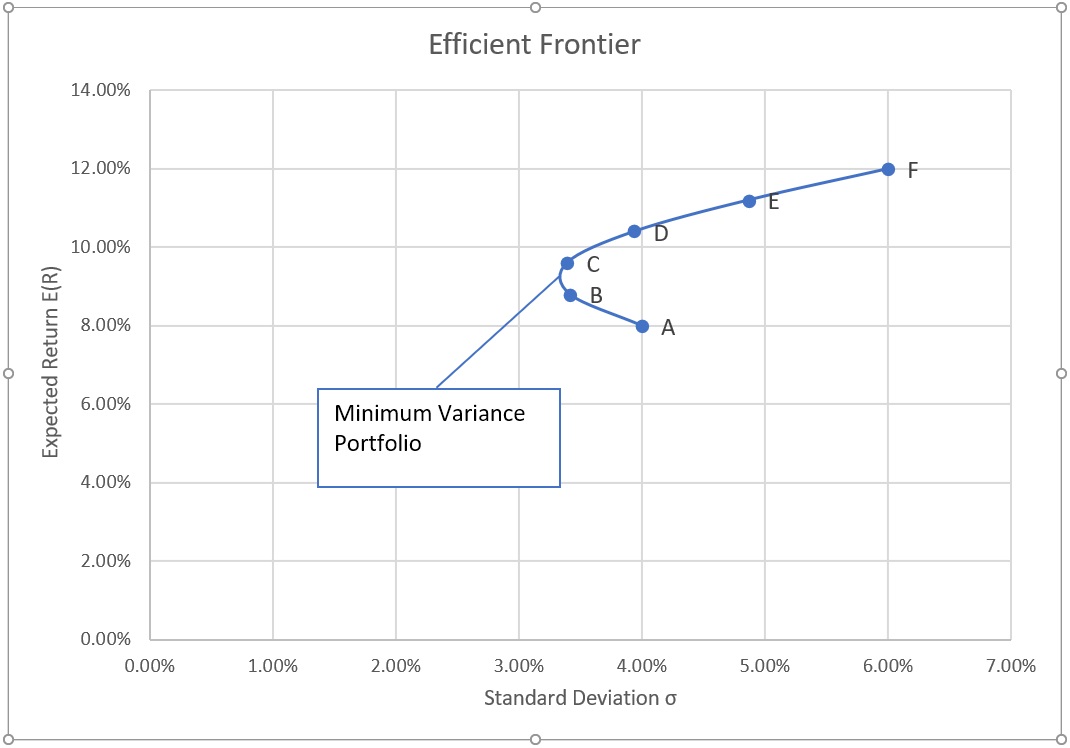
Portfolio mix at Point C and D are better than B and A respectively because they offer higher expected return at for the same level of risk.
The left-most point on the curve is the global minimum variance portfolio, the portfolio that has the lowest possible risk as measured by the standard deviation. However, it is not necessarily the best risk-return trade-off. As we move to portfolio C, D, E and F, there will be a point at which the investor’s utility curve will intersect the efficient portfolio. It will be the best possible portfolio for the given investor.
by Obaidullah Jan, ACA, CFA and last modified on