Inventory Investment
Inventory investment, also referred to as change in private inventories (CIPI) by the BEA, is a component of gross private investment of GDP that represents the difference between production and sales during the period.
Gross domestic product (GDP) tells us about the level of production in an economy. There are two popular approaches to calculating GDP: the expenditure approach and the income approach. The expenditure approach works out GDP as the sum of private consumption (C), private investment (I), government spending (G) and net exports (i.e. exports (X) – imports (I)). On the hand, the income approach measures GDP as the sum of all factor incomes i.e. wages, rents, interest and dividends.
When the expenditure approach is used, GDP is calculated using the following equation (called the national income accounts identity):
$$ \text{GDP}\ =\ \text{C}\ +\ \text{I}\ +\ \text{G}+\ \text{X}\ - \text{M} $$
The private consumption C (more specifically referred to as private consumption expenditure) represents spending by consumers on goods and services. What is spending for consumers is actually sales and revenue for businesses. But a business’s revenue can deviate from market value of production because it is quite possible that it may not be able to sell all it produces in a given period. In such a situation production equals the sum of sales (i.e. C) and closing inventories (CI) minus opening inventories (OI):
$$ \text{Production}\ =\ \text{C}+\ \text{CI}\ -\ \text{OI} $$
The excess of closing inventories over opening inventories represents the change inventories which is reflected as part of the private investment component. When there is excess production i.e. production exceeds sales (and hence C), it is assumed that the businesses purchase the inventories themselves at the market price. Similarly, when sales exceed production because businesses sell their inventories, change is reflected as part of private investment (I) assuming that the companies liquidated their inventory investment.
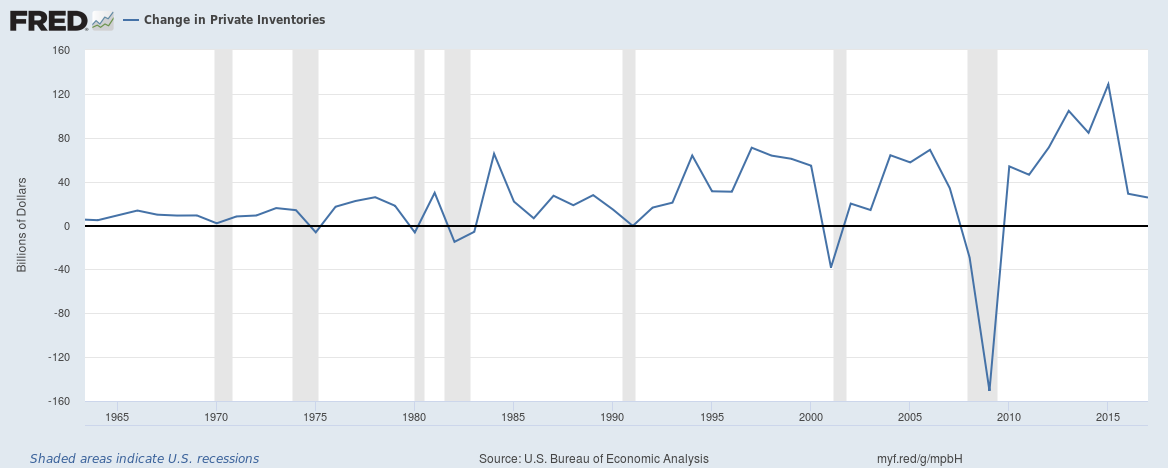
Change in private inventories is an important economic indicator. Looking at the following graph extracted from St. Loius FED FRED system, you can see that as economy enters recessions (grey areas), inventory investment is negative. It is because firms have low confidence and they cut down on production and instead let its inventories stock liquidate.
Example
Consider the following data for US (obtained from BEA website: www.bea.gov). All amounts are in billions of US Dollars.
| Line | 2017 | 2017 | 2017 | 2017 | 2018 | 2018 | 2018 | |
|---|---|---|---|---|---|---|---|---|
| Q1 | Q2 | Q3 | Q4 | Q1 | Q2 | Q3 | ||
| 1 | Gross domestic product | 19,163 | 19,359 | 19,588 | 19,832 | 20,041 | 20,412 | 20,660 |
| 2 | Personal consumption expenditures (C) | 13,114 | 13,233 | 13,359 | 13,579 | 13,680 | 13,876 | 14,052 |
| 7 | Private investment (I) | 3,279 | 3,338 | 3,414 | 3,441 | 3,544 | 3,580 | 3,709 |
| 8 | Fixed investment | 3,271 | 3,321 | 3,359 | 3,420 | 3,507 | 3,590 | 3,620 |
| 9 | Nonresidential | 2,525 | 2,577 | 2,607 | 2,643 | 2,720 | 2,791 | 2,819 |
| 13 | Residential | 746 | 744 | 752 | 777 | 787 | 799 | 800 |
| 14 | Change in private inventories | 8 | 17 | 55 | 22 | 36 | (10) | 89 |
| 15 | Net exports (X - M) | (577) | (572) | (557) | (608) | (639) | (550) | (651) |
| 22 | Government spending | 3,346 | 3,360 | 3,372 | 3,419 | 3,457 | 3,507 | 3,551 |
You can see that the change in private inventories (Line 14) is $36 billion in Q1 of 2018 which means that in this quarter, businesses produced more than what consumers consumed (Line 2). Because production is higher than consumption, the excess inventories are recorded as private investment. In Q2 of the same year, the change in business inventories is - $10 billion which means that production has been lower than consumption, hence the excess of consumption over production is subtracted from private investment.
by Obaidullah Jan, ACA, CFA and last modified on