GDP Growth Rate
GDP growth rate or simply growth rate of an economy is the percentage by which the real GDP of an economy increases in a period. If the growth rate of an economy is g, its output doubles in 70/g periods.
When an economy’s growth rate is positive, the economy’s output is increasing, and it is said to be in recovery or in economic boom. But when the growth rate is negative, the economy is in a recession i.e. output is contracting.
The growth rate of GDP differs from the growth rate of GDP per capita simply because GDP per capita also depends on the population of the country which grows independently of the output. Growth rate of GDP per capita is a better measure of improvement in standard of life of an average person in the economy.
You must be wondering why we use the rate of change in real GDP as a measure of an economy’s growth rate instead of the rate of change of nominal GDP. It is because we are interested in finding out the increase in productive capacity of the economy. It means that we need to exclude the increase in GDP solely due to increase in price level.
The percentage change in nominal GDP broadly equals the growth rate (g) plus inflation rate (π).
$$ \text{%\ Change in Nominal GDP}=\text{g}\ +\ \pi $$
Calculation
The following formula can be used to calculate growth rate of an economy for a single period:
$$ \text{g}=\frac{{\text{GDP}} _ \text{n}-{\text{GDP}} _ {\text{n}-\text{1}}}{{\text{GDP}} _ {\text{n}-\text{1}}} $$
Where GDPn is the real GDP in current year and GDPn-1 is the real GDP in the previous period.
If we want to calculate the average compound growth rate over multiple periods, we need to use the following formula:
$$ \text{g}=\left(\frac{{\text{GDP}} _ \text{t}}{{\text{GDP}} _ \text{0}}\right)^\frac{\text{1}}{\text{t}}-\text{1} $$
Where GDPt is the latest real GDP, GDP0 is the earlier GDP and t is the number of periods.
The equation for compound average growth rate can be modified to find out the formula for future value of GDP given a constant growth rate g over t periods:
$$ {\text{GDP}} _ \text{t}={\text{GDP}} _ \text{0}\times{(\text{1}+\text{g})}^\text{t} $$
Example
The following table shows US GDP data in trillions of US Dollars.
| Year | 2015 | 2016 | 2017 |
|---|---|---|---|
| Nominal GDP | 18.12 | 18.62 | 19.39 |
| Real GDP (2012 Dollars) | 17.37 | 17.66 | 18.05 |
The GDP growth rate for 2016 can be worked out as follows:
$$ \text{g} _ {\text{2016}}=\frac{{\rm \text{GDP}} _ {\text{2016}}-{\rm \text{GDP}} _ {\text{2015}}}{{\rm \text{GDP}} _ {\text{2015}}}=\frac{\text{17.66}-\text{17.37}}{\text{17.37}}=\text{1.67%} $$
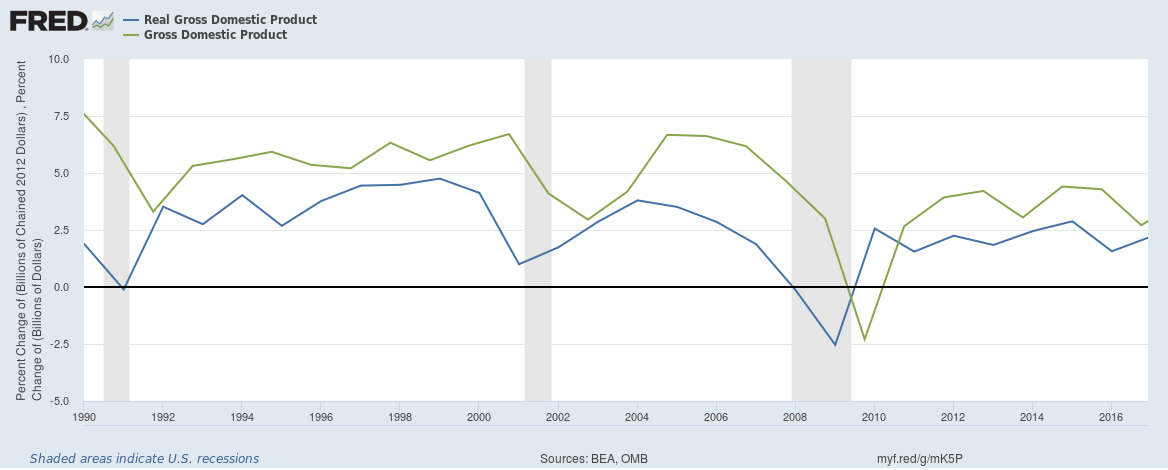
Please note that the growth rate of 1.67% worked out above is lower than the percentage change in nominal GDP in 2016 of 2.76%. The difference of 1.09% is attributable to change in price level. This is precisely the reason that the percentage change in nominal GDP curve is above the real GDP percentage growth curve in the graph below (obtained from FRED):
The average growth rate from 2015 to 2017 can be worked out using the formula for CAGR:
$$ \text{g} _ {\text{2017}-\text{2015}}=\left(\frac{\text{18.05}}{\text{17.37}}\right)^\frac{\text{1}}{\text{2}}-\text{1}=\text{1.94%} $$
by Obaidullah Jan, ACA, CFA and last modified on