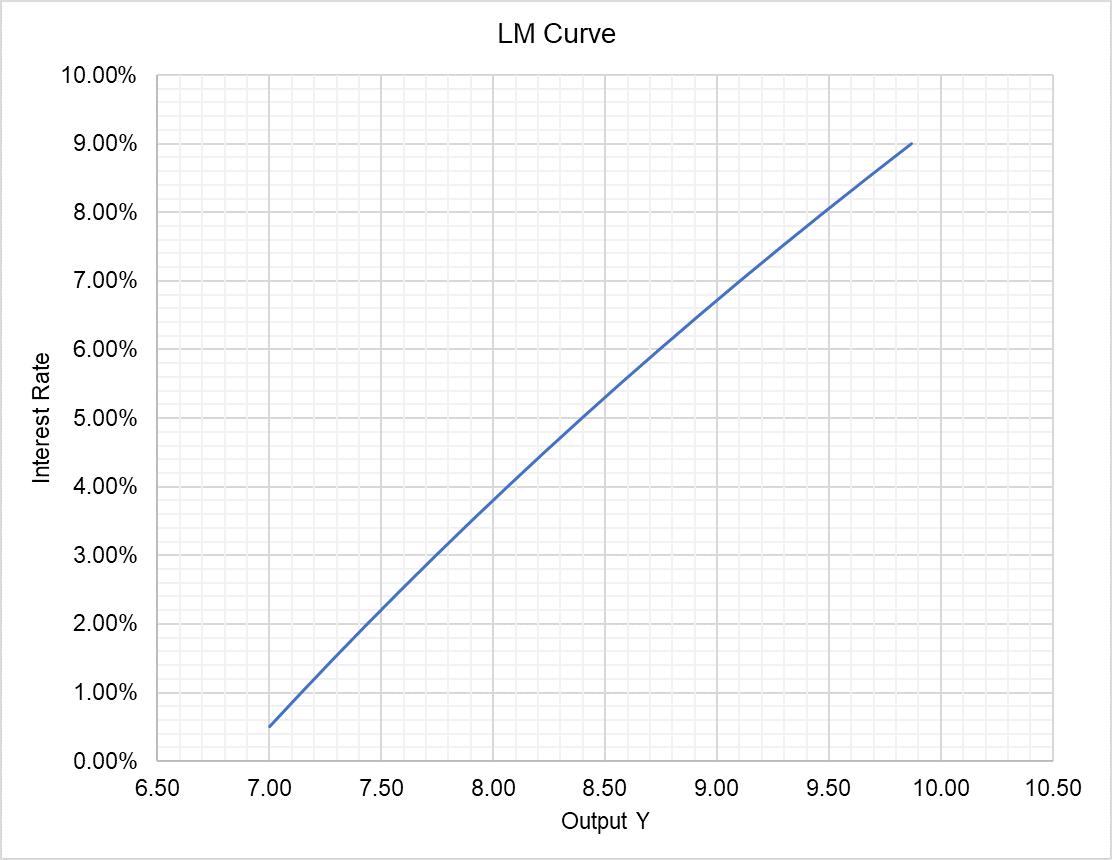
LM Curve
LM curve is a graph that plots equilibrium output dictated by the financial market at different interest levels. It slopes upward because high output/GDP is associated with high interest rate due to high demand for money and vice versa.
IS curve and LM curve are the two components of IS-LM model, a model of combined equilibrium in the goods market and the financial market.
LM curve is derived from a schedule of equilibrium output/GDP that correspond to different interest levels. It represents the snapshot of the financial market i.e. the prevailing interest rate at different output levels.
Graph
People demand money in order to make transactions. The theory of liquidity preference postulates that demand for money in an economy increases with increase in income and decreases with increase in interest rate and vice versa. When the interest rate is low, people keep more money because they prefer liquidity and it is cheaper to hold money. As soon as the interest rate increases, people reduce their cash in hand because it is costly (opportunity cost-wise) to do so. It is why the money demand curve slopes downward.
Money supply in an economy, on the other hand, is controlled by the central bank. It depends on the monetary base, reserve requirements, open market operations which are all heavily influenced by the central bank. It is why the money supply curve is vertical.
As shown in the graph below, r1, the intersection of money demand curve and money supply curve shows the equilibrium interest rate.
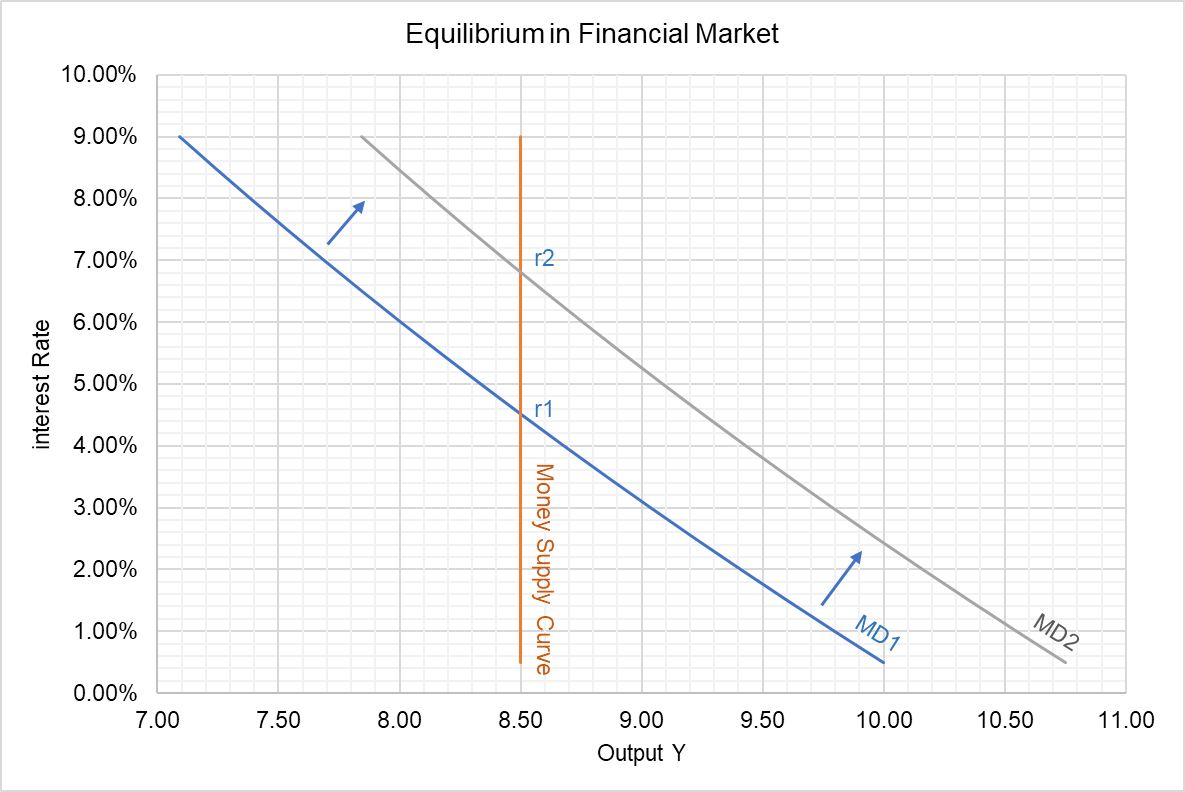
If the velocity of money (the number of times a dollar is used to make transactions in a period) is constant, any change in income level changes demand for money balances. If there is an increase in income, money demand curve shifts outwards which causes an increase in market interest rate and vice versa. In the graph above, the outwards movement of the money demand curve from MD1 to MD2 has increased the equilibrium interest rate from r1 to r2.
The LM curve plots different income/output levels that correspond to different interest rate levels.
LM Curve & Monetary Policy
The LM curve shifts when there is a change in monetary policy. Central banks, such as US Federal Reserve Bank, change money supply mainly through open market operations, changes in reserve ratio, discount rate, etc. In reality, central banks actually attempt to take the financial market to a specific equilibrium interest rate.
A monetary expansion is when a central bank purchases bonds from banks, decreases reserve ratio, etc. When money supply curve shifts outward, market interest rate falls and the LM curve shifts outward. It is because due to higher supply of money, a higher output is possible at the same interest rate. The opposite occurs in a monetary contraction.
Similarly, fiscal policy changes such as changes in government spending and taxes shift the IS curve. The interplay of the shifts in IS and LM curves explain the short-run economic fluctuations.
by Obaidullah Jan, ACA, CFA and last modified on