IS Curve
IS curve is a schedule/curve that shows the equilibrium output level that occurs in the market for goods and services at different levels of interest. The IS curve is one part of the IS-LM model and it is plotted with interest on y-axis and output on x-axis.
The equilibrium in the goods market depends on the interplay of aggregate demand (expenditure) and income. In a closed economy, aggregate demand is the sum of personal consumption expenditures (C), investment (I) and government spending (G):
$$ \text{AD}=\text{C}+\text{I}+\text{G} $$
Consumption (C) depends on disposable income which equals autonomous spending (c0), spending that occurs even at zero income, plus the product of marginal propensity to consume (c) and disposable income. Disposable income equals total income (Y) minus taxes (t). The consumption function can be written as follows:
$$ \text{C}=\text{c} _ \text{0}+\text{c}\times(\text{Y}\ -\ \text{t}) $$
Investment (I) depends on income level and interest rate. When the income level is high in the economy, firms invest more in order to meet the increased demand and vice versa. Similarly, if the interest rate is low, investing in new capital is cheaper and hence investment spending is higher.
We can rewrite aggregate demand function as follows:
$$ \text{AD}=\text{c} _ \text{0}+\text{c}\times(\text{Y}\ -\ \text{t})+\text{I}(\text{Y} \text{,} \text{i})+\text{G}+\text{NX} $$
Keynesian Cross
Equilibrium in the goods market occurs when expenditure equals production. It is graphically represented by the Keynesian cross which is the graph of expenditure and output level.
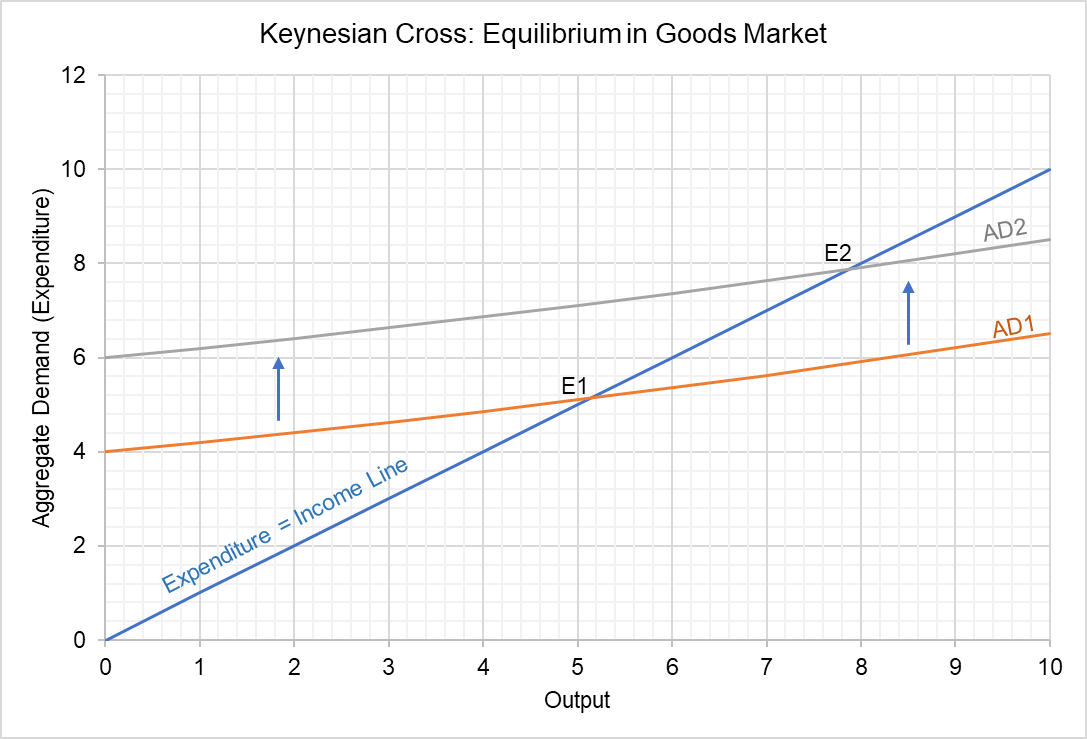
E1 is the initial equilibrium of the goods market. It is the point of intersection of the aggregate expenditure curve AD1 and the 45-degree line (which shows points where aggregate expenditure equals production) is the market-clearing output level of goods.
Since the investment spending is a function of interest rate, the aggregate demand curve shifts when there is a change in interest rate which in turn results in a change in total output corresponding to the new equilibrium E2.
The IS curve is a graph of different level of equilibrium aggregate expenditure at different interest rate levels. The IS curve plots the equilibrium output at different interest levels.
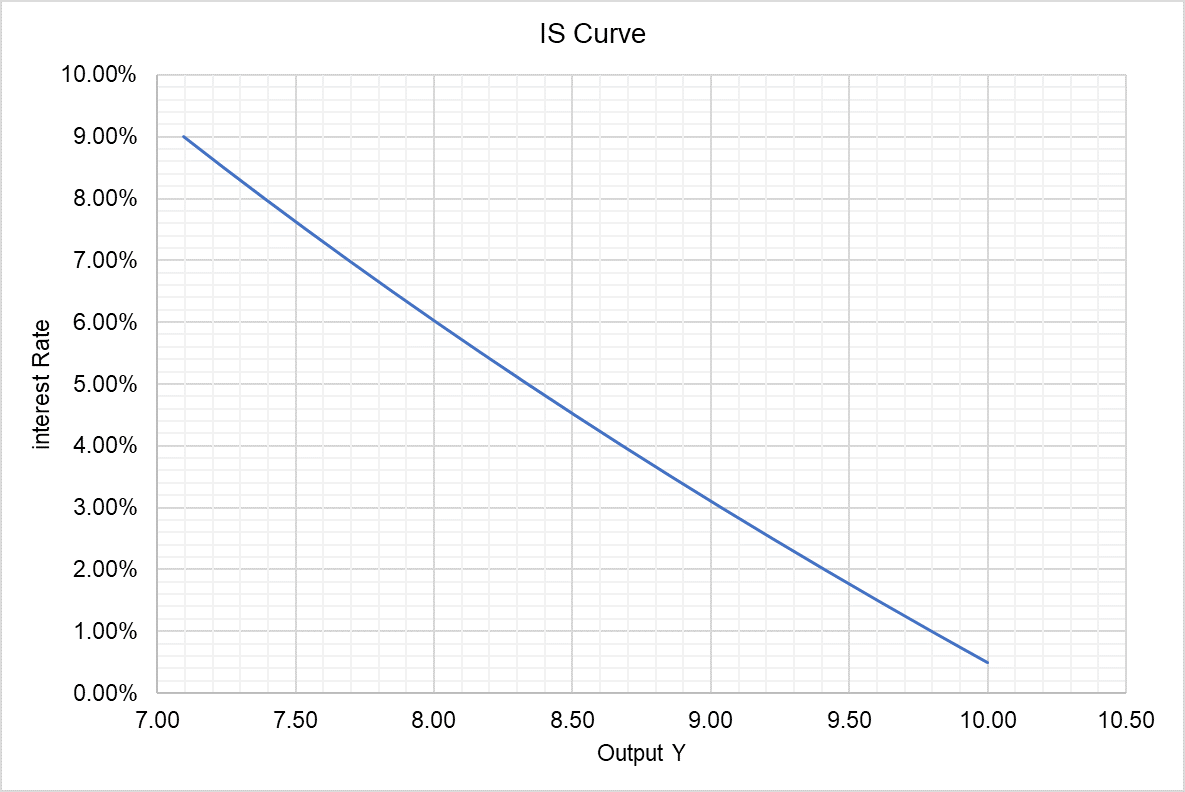
The IS curve slopes downward. It is because when the interest rate is high, output is low because investment is low and vice versa.
Together with LM curve, the IS curve completes the IS-LM model.
by Obaidullah Jan, ACA, CFA and last modified on