Phillips Curve
Phillips curve refers to the trade-off between inflation and unemployment. It shows that in the short-run, low unemployment rate results in high inflation and vice versa.
The inverse relationship between inflation rate and unemployment rate is named after AWH Phillips, a New Zealand-born economist who initially discovered that there is a negative relationship between unemployment rate and changes in nominal wages in the UK. Soon other economists observed that this relationship holds between unemployment and the general price level.
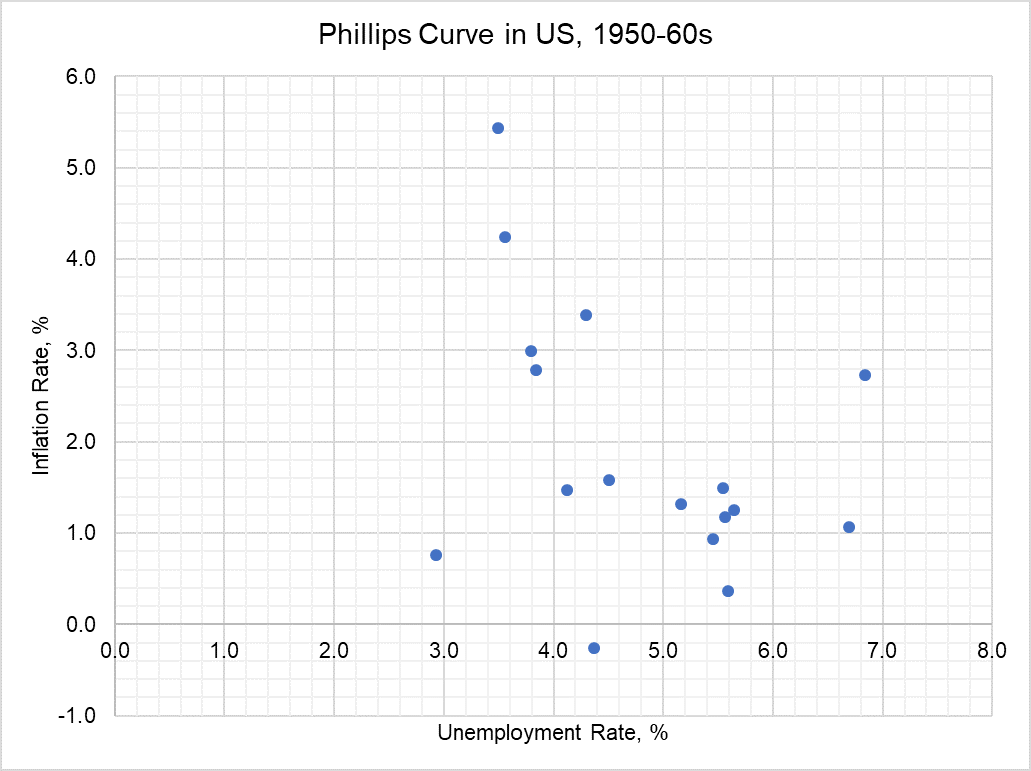
The original Phillips curve is plotted with inflation rate on the y-axis and unemployment rate on the x-axis as shown in the graph below. It clearly shows that unemployment rate tends to increase when the inflation rate is low.
Weakness of Original Phillips Curve
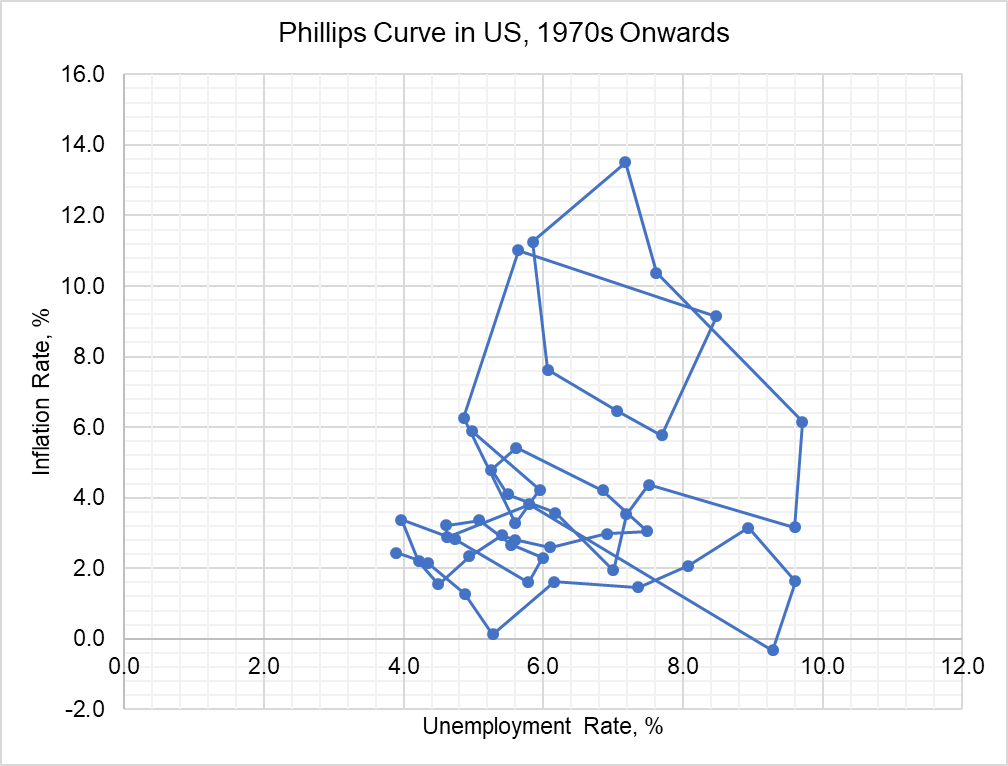
During 1960s, the Phillips curve largely remained intact but in 1980s it broke down when US economy suffered from stagnation, a combination of high unemployment and high inflation rate. This led economists to conclude that there are other factors which also affect the Phillips curve relationship such as supply shocks and expected inflation and it resulted in the new or modified Phillips curve.
The graph below shows the relationship between inflation and unemployment in US since 1970s. It doesn’t look like a curve, which shows that in the long-run there is no trade-off between inflation and unemployment.
Modified Phillips Curve
In order to address this weakness of the original Phillips curve, economists have come up with the modified Phillips curve, which plots relationship between changes in inflation rate and unemployment rate.
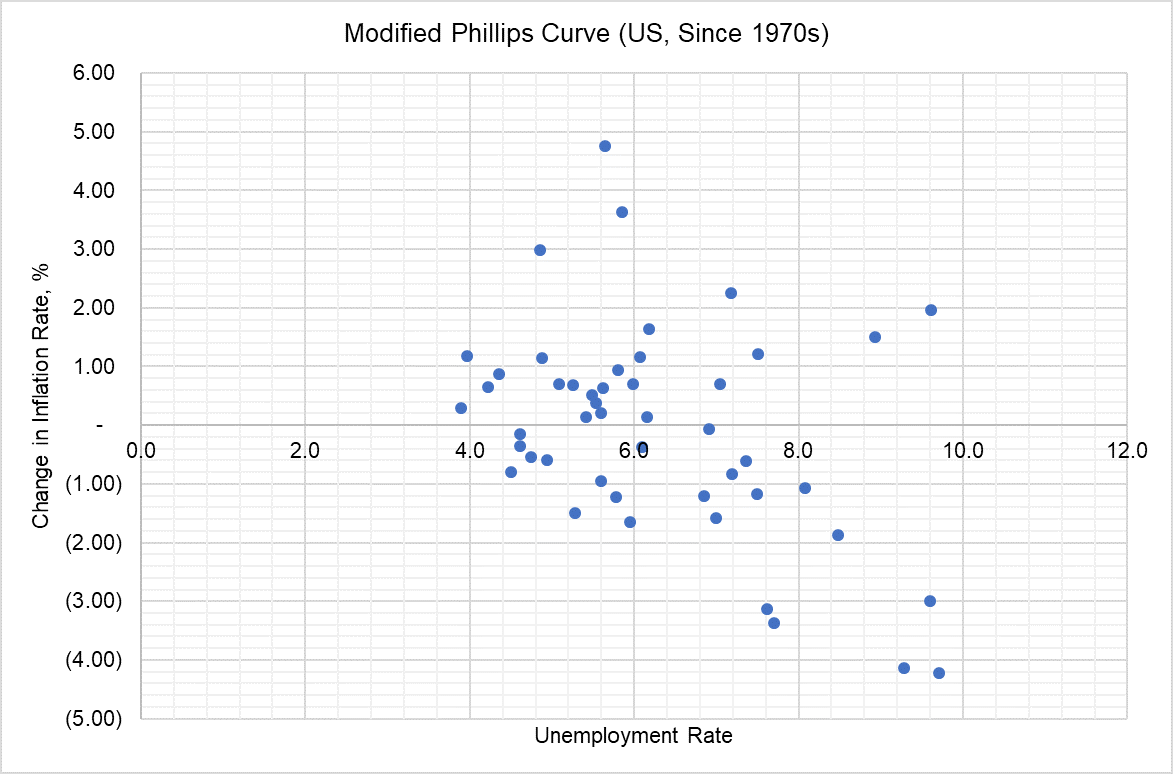
The modified Phillips curve is more likely candidate of a plausible relationship. It is based on the concept that actual inflation rate depends on what people expect inflation rate to be in future adjusted for the effect of any cyclical unemployment or supply shocks.
This can be expressed mathematically as follows:
$$ \pi=\pi _ \text{e}-\beta\times(\text{u}\ -\ \text{u} _ \text{n})+\text{v} $$
Where π is the actual inflation rate, un is the πe is expected inflation rate, u is the actual rate of unemployment rate, un is the natural rate of unemployment, β is a coefficient that represents the responsiveness of inflation to changes in unemployment and v represents supply shocks.
You must be wondering why expected inflation matters. It matters because when current or past prices are high, people expect prices to be high in future and build-in this expectation in their economic transactions. Such expectation is self-fulfilling because when all people expect prices to increase, they do increase. Inflation also depends on supply shock, that is, any adverse movement in factor costs such as steep changes in global oil price, etc.
by Obaidullah Jan, ACA, CFA and last modified on