Isoquants
Isoquants are curves that represent efficient blend of different inputs such as labor and capital which yield the same (iso) level of output (quantity). Isoquants are usually downward sloping convex curves whose shape depend on the degree of substitution between different inputs.
Isoquants are plotted with labor on one axis (generally the x-axis) and capital on the other axis i.e. the y-axis. There are three types of isoquants depending on their shapes: (a) straight-line, (b) right-angle and (c) curved.
The straight-line and right-angle isoquants are extreme scenarios which represent inputs that perfect substitutes and perfect complements respectively. When both inputs are perfect substitutes, isoquants are straight line and have a constant slope because one input can be replaced with the other at the same rate. Similarly, when no substitution is possible at all, the isoquants take the shape of a right angle which means that a fixed proportion must always be maintained between the two inputs. Curved isoquants are the most typical isoquants which represent inputs which are neither perfect substitutes nor perfect complements. They are convex in shape which means that they are steeper near the y-axis and gets flatter as they reach x-axis.
Isoquants are to producers what indifference curves are to consumers. While the indifference curves tell us about different combinations of two products that give a consumer same level of satisfaction, isoquants tell us about different mixtures of inputs that generate the same level of output. Many properties of the isoquants are like those of indifference curves, namely:
- Isoquants that are to the left represent a higher production level than isoquants which are closer to the vertex (i.e. origin): an isoquant that represent 6 units produced is to the left of an isoquant that represent production of 4 units.
- Isoquants do not cross each other: an isoquant representing 6 units can’t cross an isoquant representing 4 units because if they do, it would mean two production levels corresponding to a single combination of labor and capital. We need to stick to the more efficient production point.
- Isoquants are downward sloping and their slope change as we move along the curves
Example
Consider the A1A Car Wash again. Each car wash takes 30 minutes of a worker’s time and 30 minutes of wash bay occupancy. The following three scenarios correspond to three different types of isoquants:
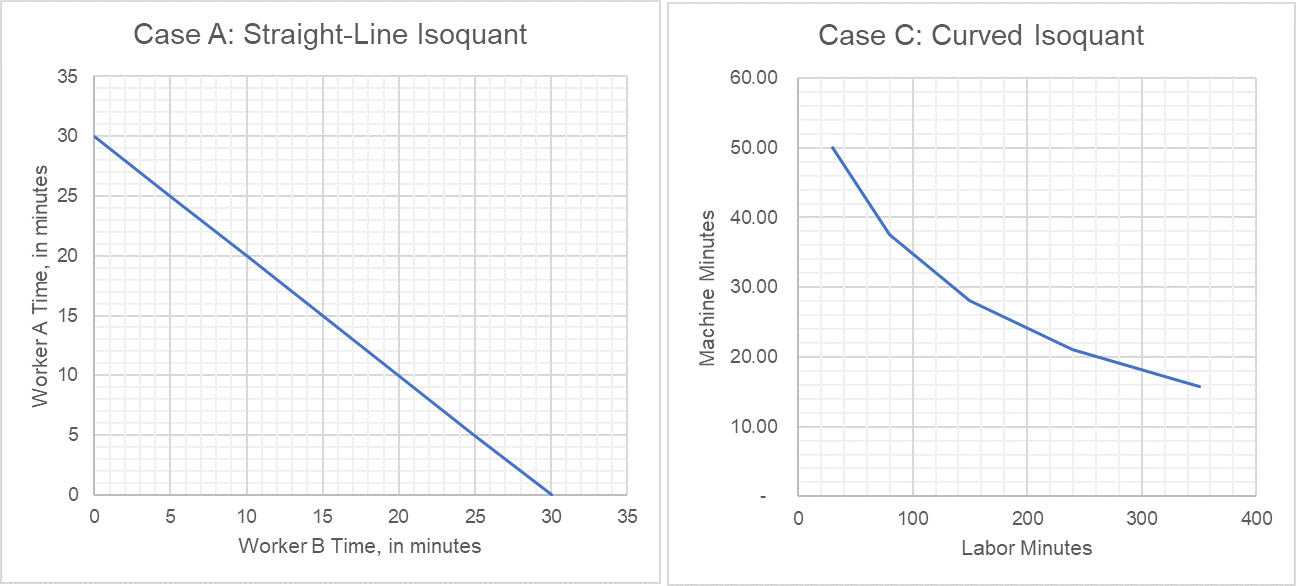
- Case A: if the owner, Skyler White, wants to draw an isoquant representing combination of time spent by different workers on car washes, it would be a straight line because if all workers are equally skilled, one worker can be easily substituted with other.
- Case B: an isoquant representing combination of wash bay time and worker time would be form a right angle because 30 minutes of wash bay and 30 minutes of worker time are needed in equal proportion for each additional car wash.
- Case C: an isoquant representing a combination of robotic car wash machines and workers would be a convex curve.
The following graph plots the isoquant curve for Case A and Case C:
by Obaidullah Jan, ACA, CFA and last modified on